11/16/2016

Trump Rally or Catch-up Rally?

Based on prices as of November 11, 2016; views effective November 21, 2016

The press has been talking about a Trump stock market rally. Trump’s election roughly coincided with the beginning of sharp increase in stock prices over the last week. Is this really a Trump rally? Or was Trump’s victory associated with a move that would have taken place anyway?

According to the Market Resilience Indexes (MRI) developed by Focused 15 Investing, the stock market’s inherent resilience started to move higher a week before the election, as published on Nov 1. The markets moved up, as anticipated, beginning Monday, Nov 7, the day before the election. Monday’s price move coincided with polls suggesting Clinton was ahead. The rally continued through the rest of the week after Trump won the necessary electoral votes. It has been a catch-up rally.

The appropriate way to think of the last couple of months is that prices were abnormally depressed prior to the election. On the 7th, the depression began to ease.

Recent Malaise


Over the last few months, the bounce off the March trough of the phantom bear market has been weak. We had rally-like MRI levels and behavior… but not rally-like price behavior. In past commentaries, I described the last few months as a malaise and an anemic rally. This weakness may have been the result of some or all of these factors:
  1. The fact that the phantom bear market did not produce price declines in the US, and there was no capitulation, which meant there was no real bear market and therefore no reason to rally
  2. The fear that our last remaining monetary tools were not boosting growth
  3. The global markets were struggling to come to terms with the massive decline in oil prices and what that meant for global growth (and its subcomponent, struggling to assess the impact of the Saudis’ focus on market share rather than price)
  4. Concern about US election uncertainty
Last week’s move caught the market up to roughly where it should have been based on its own inherent resilience, regardless of whether Trump or Clinton won. The catalyst was a natural inflection point in market resilience. It does not appear to be a market verdict on the US election.
A possible qualitative rationale is that both candidates would likely increase spending on infrastructure, taking heed of suggestions by economists and the central banks. The prospect of moving forward on spending and infrastructure programs and having the election behind us may have been a relief.

If we accept that we have had a catch-up rally, we gain some perspective on the near-term future. Going forward, the current situation suggests that prices still have an upside. The Micro MRIs, those with a 6 to 12 week horizon, for most equity markets are still clearly positive and are likely to be for several weeks. Thus, we are still early in the rising trend. Continued exposure to the US stock market is appropriate.

How About a Price Reversal?


After a period of strong returns, the market sometimes experiences losses. The Dow Jones industrial average was up about 5% election week. This return is abnormally high for a one-week time period. The idea of a reversal suggests that the market has moved too far and overshot the “appropriate” price level. Prices may fall back to where they started, or even further.

We evaluated over 100 years of market history for the DJIA and almost that for the S&P, plus the full histories of the TOPIX (Japanese Stocks) and Russell 2000 to determine the circumstances when price reversals typically occur. It turns out that some markets do experience price reversals that can be predicted systematically. However, the current situation does not appear to be one of the classic situations where a price reversal typically occurs.

Price declines can certainly happen over the next few weeks, but they are likely to be mild and/or short-lived. Further increases in resilience should ultimately lead to stronger support for stock prices. The best strategy at this time is to hold tight. Accordingly, the Focused 15 Investing portfolios have had relatively high allocations to their stock ETFs prior to the election, and this will continue.

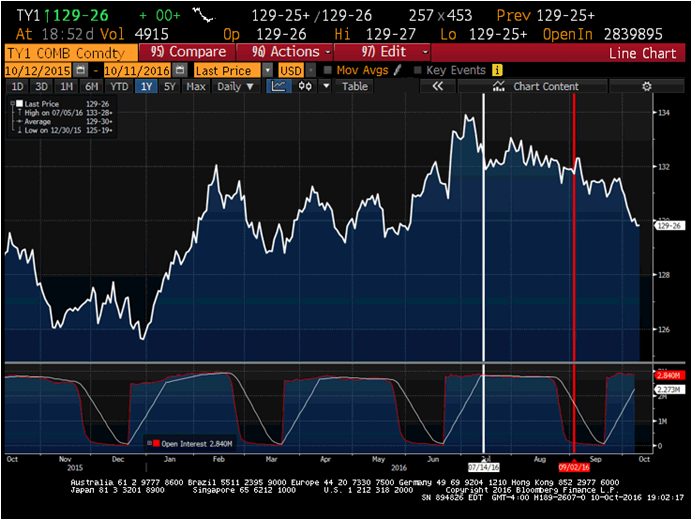
Bond yields (10y) continue to have positive Micro and Exceptional Macro MRI ratings — suggesting higher rates. However, the Macro for the 10y bond is still stubbornly negative, suggesting that a longer-term trend for higher rates has not started. Short term, however, markets will fear rising rates. 

11/09/2016

Election Week Update

The philosophy of Focused 15 Investing is to make bets based on the resilience of the markets rather than on the outcome of future events. Resilience is easier to measure and evaluate systematically than varied future events. This week’s presidential election is a prime example of how that philosophy can play out. Many investment strategists expected the markets to decline after a Trump victory (and to rise after a Clinton victory). My work suggested markets would trend higher regardless of the winner. On November 2, I wrote:

For the week of November 7, US stocks have a resilience rating of 2, up from 1 the prior week. This higher rating is because the Micro Market Resilience Index MRI has turned positive and is now gaining strength. This is an important shift and could lead to higher prices, barring strongly negative news or events. 

The effective date for this rating is 11/7/2016. The US presidential election will be held the following day. Resilience will be higher that week regardless of which candidate wins. Some observers will say that the markets are rendering a verdict on the winner, but my statistics suggest that it is simply the beginning of a normal short cyclical move providing support for higher prices.

Since the market’s close last Friday, the Dow Jones Industrial Average is up about 4%. I believe that I would be saying essentially the same thing if Clinton had won. The magnitude might be more or less, but I believe it would still be positive.

Looking forward, the market may decline and give back some of these gains. However, the positive trend is likely to continue. Many of the major stock markets around the world are experiencing greater resilience, not just the US markets. This also would have taken place in the short term, even if Clinton had won.

--


Overview of market resilience ratings for stock, bond and commodity markets for the next few weeks. #marketResilienceIndexes #marketOutlook #InvestmentResearch 

11/01/2016

Week of 11/7/2016 - Market Resilience Index Ratings

Week of 11/7/2016 – Market Resilience Index Ratings

Both the US stock and bond markets have been through a period of heightened vulnerability over the last several weeks. For the week of November 7, US stocks have a resilience rating of 2, up from 1 the prior week. This higher rating is because the Micro Market Resilience Index MRI has turned positive and is now gaining strength. This is an important shift and could lead to higher prices, barring strongly negative news or events.


The effective date for this rating is 11/7/2016. The US presidential election will be held the following day. Resilience will be higher that week regardless of which candidate wins. Some observers will say that the markets are rendering a verdict on the winner, but my statistics suggest that it is simply the beginning of a normal short cyclical move providing support for higher prices. Of the 5000+ weeks since 1919, 87% had a higher Micro Resilience level than last week’s level, which means it is currently near the lower extreme. Since the Micro MRI is particularly rhythmic in its movement up and down, it is a good bet that it will move higher over the next several weeks and provide support for prices.

Should the stock market decline after the election, possibly in reaction to the winner, the decline is likely to be short-lived. There will likely be a rebound, and "market concerns" will seem to pass quickly. Coincidentally, the level of the Micro MRI now is very similar to its level at the time of the Brexit vote. After Brexit, there was a decline in the US stock market and then a meaningful recovery.

In an earlier market (link) overview, I mentioned that the period of March 2015 through January 2016 was a bear market in terms of MRI levels, but one that failed to produce large-scale declines, panic or capitulation. As 2016 has progressed, the resilience measures indicate that we are rebounding off the bottom of our phantom bear market. However, that rebound is not as strong as is typically the case just after bear markets that are expressed as major price declines. This mid-term malaise is detectable in the US stock market’s MRI levels and is evident by the current lack of the Exceptional Macro MRI. In a typical rebound, the Exceptional Macro MRI persists for several quarters. In this one, it lasted just a few months.

The anemic rebound may be a reflection of concerns about global growth, US election uncertainty, and conflicts in the Middle East. Thus, while we can expect higher stock market resilience (which supports higher prices) through the end of the year, the New Year could bring a change in the overall character of the market.

Global Stocks
The European stock market has a rating of 1, unchanged from last week. Out of the major equity markets, this one shows most stress. Its positive Exceptional Macro Resilience MRI has failed to result in a positive Macro MRI, which would be expected over the next few weeks.

The Japanese and Chinese (Shanghai Composite) stock markets are beginning to show more resilience, with ratings of 2. Emerging Market stocks continue to be resilient (rating 3).

The global stock as a whole appears more resilient. The rating of the MSCI World stock market index is 2. I believe that rating will increase to 3 over the next few weeks.

I analyzed the relative resilience between Contrarian mutual funds (funds that buy low quality company stocks) and Quality Growth stock mutual funds. Over recent months, the low quality stocks have been favored over high quality stocks. It appears that this will continue for the next several weeks, and may even be more pronounced.

Commodities

Commodities in general continue to be resilient, with the exception of Gold. Its resilience is deteriorating. Gold has declined in price recently and there may be a temporary stabilization of Gold prices. Mid- and longer-term, however, it appears that its resilience will be weak. It is currently rated 1.

Crude Oil is currently rated 3, the highest resilience rating. I expect it to drop to 2 in the next few weeks. Price increases may not occur or may be more muted at that time. At the moment, the Macro and Exceptional Macro MRIs are positive and strongly so.

Bonds

Resilience in bond markets in general is deteriorating. For example, the US High Yield bonds market is rated 2, down from 3 the prior week.

Finally, global inflation-linked bonds are more resilient than global bonds. This reflects heightened inflation concerns. Based on the MRI ratings, I expect inflation-linked bonds to continue to be favored for the next several quarters. Of course, a shift toward higher inflation has been expected for some time, and there have been several false starts over the last three years.

10/12/2016

Week of 10/17/2016 - Market Resilience Index Ratings


Week of 10/17/2016 – Market Resilience Index Ratings

Both the US stock and bond markets have been through a period of heightened vulnerability over the last several weeks.  As expected, bonds (as measured by TY1) moved to a higher rating this week.

The tables below show the Market Resilience Index Ratings for both US 10y bonds and US stocks. The first table and chart focus on US 10y bonds (TY1). The ratings have indicated low resilience (meaning moderate vulnerability) for the last several weeks.


Trade Date
8/12/2016
8/19/2016
8/26/2016
9/2/2016
9/9/2016
9/16/2016
9/23/2016
9/30/2016
10/7/2016
10/14/2016
Bond Market Rating (TY1)
2
2
2
1
1
1
1
1
1*
2
                * Likely to move to a rating of 2 over next few weeks.

The recent price movements have not been large, but there is some indication that prices have moved according to the resilience measures.  The screenshot below shows the price of TY1 along with two vertical lines. The first line (white) shows when the rating dropped to 2 from 3, effective 7/14/2016. This indicates that high resilience had peaked. One can see that the prices peaked just before that date. The second vertical line (red) shows when the rating dropped to 1 from 2, effective 9/2/2016. One can see that prices softened after that time. The minimum rating is 0, so there was still some resilience for bond prices. The current reading, effective this Friday 10/14/2016, indicates stronger support for bond prices.   Thus, bond prices are likely to stabilize over the next few weeks and could even move higher.


US stocks, as measured by the Dow Jones Industrial Average, currently have a rating of 1 and may soon move to a rating of 2.  While an upgrade has not happened yet, I expect it to take place within a few weeks. Of the 5000+ weeks since 1919, 84% of them have had Micro MRI levels higher than the current reading.  This suggests that we are closer to the beginning of a strengthening of prices than to additional price declines because of a lack of resilience. However, the resilience reading is still low so there may be some near term declines.  

Between now and that shift, we may have some price dips that represent global stresses, but the duration of the dips is likely to be short given that we see some modest level of resilience in a number of equity markets globally.  These stock markets are rated 2 (moderately resilient) or 3 (resilient) for this week: MSCI World, DJ Transports, NASDAQ, Russell 2000, UK Stocks, Emerging Market stocks. These observations suggest that, barring major negative news or events, US stock prices can reach new highs over the next month or so.

Commodities have the highest resilience of the major asset classes right now.


The S&P Goldman Sachs Commodity Index represents a basket of commodities with a high weighting in crude oil. Crude oil (not shown in graphic) continues to have a rating of 3. Please note that crude is a volatile asset and can differ meaningfully week to week from the MRI ratings. Over long periods of time, however, the ratings result in profitable trades.

Gold has a rating of 2, moderately resilient. There may be near-term price softness, but the Macro and Exceptional Macro MRI continue to be positive, and prices are likely to be more resilient mid-to-longer term.

There are changes this week for currencies. The GBPUSD has a new rating of 1, which means there is even less support for the GBP. It has already fallen in response to Brexit concerns. The recent shift in vulnerability suggests that value may continue to weaken; buying GBP right now is likely to be premature.


The dollar index (DXY) has moved to 1 from 0, meaning that it now has some resilience, although it is still at a very low level.


Overview of market resilience ratings for stock, bond and commodity markets. #marketResilienceIndexes #marketOutlook #InvestmentResearch 

10/05/2016

Week of 10/10/2016 - Market Resilience Index Ratings


Week of 10/10/2016 – Market Resilience Index Ratings

Both the US stock and bond markets have been through a period of slightly heightened vulnerability over the last several weeks. Over the next few weeks, I expect both markets to be able to support higher prices, with bonds likely to move higher sooner.

This note is a follow-up to the post for the week of 9/19/2016. The table below shows the Market Resilience Index Ratings for both US 10y bonds and US stocks and adds the three most recent weeks. The ratings have indicated low resilience (meaning moderate vulnerability). Compared to earlier periods, the recent price movements have not been great, but there is some indication that prices have been affected by the vulnerability. The first table and chart focus on US 10y bond (I analyze the bond futures TY1 in this case). 


Trade Date
8/5/2016
8/12/2016
8/19/2016
8/26/2016
9/2/2016
9/9/2016
9/16/2016
9/23/2016
9/30/2016
10/7/2016
Bond Market Rating (TY1)
2
2
2
2
1
1
1
1
1
1*
                * Likely to move to a rating of 2 over next few weeks.

The screen shot below shows the price to TY1 and two vertical lines. The first line (white) shows when the rating shifted to 2 from 3, effective 7/14/2016. This indicates that high resilience had peaked. One can see that the prices peaked just before that date. The second vertical line (red) shows when the rating shifted to 1 from 2, effective 9/2/2016. One can see that prices softened after that time. The minimum rating is 0, so the was still some resilience for bond prices. An important point is that from this point forward, it appears that the rating will increase. Bond prices are likely to stabilize over the next few weeks and could even move higher.


US stocks, as measured by the Dow Jones Industrial Average, currently have a rating of 1 and may soon move to a rating of 2.

Trade Date
8/5/2016
8/12/2016
8/19/2016
8/26/2016
9/2/2016
9/9/2016
9/16/2016
9/23/2016
9/30/2016
10/7/2016
DJ Industrial Average
3
3
3
2
2
2
1
1
1
1*
              * Likely to move to a rating of 2 over next few weeks.

The chart below shows the recent rating shifts for the DJIA. The green line shows the shift to 2 from 3, effective 8/16/2016, an indication that resilience had peaked. This was a good marker of the recent price action. The yellow line shows the rating shift to 1 from 2, effective 9/16/2016. This appears to be a less meaningful shift in terms of price action.


A key point is that prices have not declined meaningfully during this period of increased vulnerability, and there are signs (finer signals than described here) that the period of vulnerability will dissipate over the next few weeks.

Going forward, I do expect an upgrading of the resilience of the DJIA. While it has not happened yet,  I expect it to take place within a few weeks. Between now and that shift, we may have some price dips that represent global stresses, but the duration of the dips is likely to be short given that we see some modest level of resilience in a number of equity markets globally. 

These stock markets are rated 2 (moderately resilient) or 3 (resilient) for this week: MSCI World, DJ Transports, NASDAQ, Russell 2000, UK Stocks, Europe Stocks, Emerging Market stocks.

In total, these observations suggest that, barring major negative news or events, US stock prices can reach new highs over the next month or so.

Commodities have the highest resilience of the major asset classes right now.


The S&P Goldman Sachs Commodity Index represents a basket of commodities, with a high weighting in crude oil. Crude oil (not shown in graphic) continues to have a rating of 3. Please note that crude is a volatile asset and can differ meaningfully week to week from the MRI ratings. Over long periods of time, however, the ratings result in profitable trades.

Gold has a rating of 2, moderately resilient. There may be near-term price softness, but the Macro and Exceptional Macro MRI continue to be positive, and prices are likely to be resilient mid-to-longer term.

While much of the world is seeing growing resilience, the situation for Japan-based investors is different. The USDJPY spot rate is vulnerable to lower values, which means a stronger yen. This puts downward pressure on the returns from non-yen investments, such as sovereign bonds excluding Japan (WGBIxJ) and on the earnings of Japan’s export sensitive stocks (TPX). Both of these have new ratings of 0 this week.


The yen is likely to see additional strength. Historically, a strengthening yen has been an indicator of global economic and financial stress. Higher bond prices in the US are also an indicator of stress. These are warning signs and would challenge the resilience we are seeing in the seven stock market indexes mentioned above.

The DJIA's current rating of 1 (moderate vulnerability) is consistent with the signs of stress found in the strengthening yen and potentially higher bond prices. On balance, however, given the signs of resilience most major equity markets, I believe the stock markets will avoid major declines like those we saw in the summer of 2015 and early 2016, even if the upcoming US election and other political issues may test what resilience is found in these stock markets.

9/21/2016

Week of 9/26/2016 - Market Resilience Index Ratings

US Bonds


With a new rating of 2 on the resilience scale, the US 10y Treasury yield is moderately resilient and may resist further declines. The recent onset of the Exceptional Macro MRI may represent an inflection point in the longer-term trend for yields. 

The US 10y Treasury Futures (TY1) is rated 1 based on the Macro MRI. It lost the Exceptional Macro MRI for the week of 9/2/2016. I expect the Micro MRI to be positive over the next week or so.
                                                                                            
US high-yield bonds are rated 2, down from 3 the prior week. They are still moderately resilient. This shift was expected.

The analyses for each of these series is done independently of the others. Viewed together, they reinforce an image of interest rates trending higher from here, albeit slowly. 


Developed Market Stocks


US industrial stocks, as represented by the Dow Jones Industrial Average is rated 1.  It lost the Exceptional Macro MRI last week, which was a notable shift that signals a higher possibility of lower stock prices.
                                                                                                
UK stocks continue to be rated 2 this week.

European stock prices have a new rating of 1, down from 2 the prior week. 


Commodities


Overall, commodity prices are resilient with a rating of 3. The S&P Goldman Sachs Commodity Index represents a basket of commodities, with a high weighting in crude oil. Crude oil (not shown in graphic) continues to have a rating of 3. Please note that crude is a volatile asset and can differ meaningfully week to week from the MRI ratings. Over longer time periods, however, the ratings result in profitable trades.

Gold has a rating of 2, or moderately resilient. There may be near-term price softness, but the Macro and Exceptional Macro MRIs continue to be positive, and prices are likely to be resilient mid-to-long term.
                                                                                                    
Emerging Markets


Emerging market stock and bond prices are rated moderately resilient. At the moment, this appears to be a temporary breather because the Macro and Exceptional Macro Market Resilience Indexes are both positive for stocks and bonds.

Chinese stocks, as represented by the Shanghai Composite, have a rating of 0, which suggests vulnerability to declines.

Currencies


The Dollar index, DXY, is rated 0 and is vulnerable to declines. This is noteworthy considering concerns about rising interest rates in the US, which would typically lead to a stronger USD. We will be watching this conflicting signal.

The Euro is rated 2 this week, down from 3 the prior week. This shift was expected. EURUSD may continue to appreciate because of the positive Macro and Exceptional Macro ratings.

GBP is rated 2, which means it is moderately resilient. This is a new rating and suggests a positive shift – it was rated 0 just a month ago.


9/14/2016

Week of 9/19/2016 – Market Resilience Index Ratings

There are important rating changes this week.

Last Friday (9/9/2016) was a big day for the markets. Concerns about declining bond prices and the potential threats that rising interest rates pose to global economic growth weighed heavily on the markets. Both stock and bond markets declined. An added concern was North Korea’s test of a nuclear weapon. For the week, the DJ Industrial Index finished -2.2%, and most of that loss occurred on Friday (-2.1%).

Bloomberg News has a good summary (click here) and analyst comments (here) of the day’s market moves and what might be behind them. The article indicates that the equity market declined in response to concerns that bond prices are likely to fall from this point on. Jeffrey Gundlach, a well-respected bond manager, announced on Thursday that bond prices have peaked and are likely to decline from this time forward. The logic is that bond prices move lower because of higher interest rates. As interest rates move higher, stock prices decline because much of the increase in stock prices over the last several years has been attributed to extremely low interest rates. If interest rates move higher from here, stocks will find less support, and both stock and bond prices will fall.

The Market Resilience Index Ratings confirm his view of the bond market. The table below shows the ratings for the US 10y bond futures (TY1) and the DJ Industrial Average. The ratings are scaled from 0 to 3, with 0 being the most vulnerable and 3 being the most resilient. The ratings reflect the number of positive values of three Market Resilience Indexes: Macro, Exceptional Macro, and Micro.

>>> 

Important inflection points occur when a market gains or loses its Exceptional Macro MRI (see the tab above for an explanation of the MRI ratings). The dates of the loss of this key MRI are shown by heavy borders. 


7/15/2016
7/22/2016
7/29/2016
8/5/2016
8/12/2016
8/19/2016
8/26/2016
9/2/2016
9/9/2016
9/16/2016

   Bond Market
   Rating (TY1)
3
2
2
2
2
2
2
1
1
1

DJ Industrial Average
3
3
3
3
3
3
2
2
2
1


The MRI ratings for bonds are consistent with Mr. Gundlach’s assessment. He also states that when rates do rise (and bond prices fall), they will do so gradually. This too is supported by the MRI levels, at least for the near term. The MRI levels tend to be cyclical, and the shortest-cycle MRI is the Micro MRI. For bond prices (TY1), the level this week is low. The current level is lower than 90% of the weekly levels since March 1983. Since it is toward the lower extreme, it is becoming more likely that the Micro MRI will turn positive over the next few weeks. When it does, the rating for the bond market (TY1) will move to 2 from 1, indicating a higher level of resilience for bond prices. Clearly, Gundlach makes longer-term forecasts than I am doing here; the Focused 15 Investing approach is responsive to current market conditions as they unfold and does make long term forecasts.    

The changes in the MRI ratings for the DJ Industrial Average have moved more quickly over the recent weeks. The loss of the Exceptional Macro MRI occurred just this week. This is a important event and one that we have been watching for over the last several weeks.  The loss of this important MRI may last a few weeks or quite a bit longer.  

Regardless, we can expect the next few weeks to be a rough ride. The Micro MRI for the DJIA, which ceased to be positive on 8/26/2016, is at a moderate level and is likely to move lower. Since 1919, the Micro MRI has been higher in 55% of the weeks and lower in 45%.  Thus, there is still downside to prices and vulnerability on a short-term basis.  Without the Exceptional Macro MRI, declines are likely to be more pronounced. 

The Focused 15 Investing model portfolios have been slightly defensive for several weeks and are more defensive this week. These exposures are driven by the MRI ratings discussed here plus additional MRI-related measures.

The S&P Goldman Sachs Commodity index is now rated 3, up from 2 the prior week. This move was expected. Commodities have been beaten down over many months (with little regard to their MRI ratings) and are have been rebounding. There may be price declines, but declines are not likely to be dramatic or long lasting given their current ratings.  However, commodity prices could move against their resilience ratings as they did in 2015 given stress in the stock and bond markets. 

Emerging Market stocks also experienced losses last week. The MRI ratings on this market are more positive. It still has the important Exceptional Macro MRI, and the Micro MRI is at a high level. Only 5% of the weeks since 1989 have higher levels, so there may be near-term price declines and this may add to market stress.


7/15/2016
7/22/2016
7/29/2016
8/5/2016
8/12/2016
8/19/2016
8/26/2016
9/2/2016
9/9/2016
9/16/2016
MSCI Emerging Market Stocks
3
3
3
3
3
3
3
2
2
2

At the moment, these declines are likely to be moderated by the two other positive MRIs that give the rating of 2 (discussed briefly below). Qualitatively, these markets may be supported by higher commodity prices, as emerging market countries tend to be commodity exporters.  Should a global stress get very high, emerging markets may move in concert with major markets.   

Taking A Step Back


While all this sounds quite pessimistic, the resilience of markets globally appears stronger at this time than it did in the period March 2015 through March of 2016.  Stock markets in the UK, Europe and Emerging Markets are all more resilient at this time than in the earlier period.  Unfortunately, Japanese stocks still appear quite vulnerable.  While these circumstances can change over a period of a few weeks, markets appear able to withstand a moderate level of anxiety about growth at this time. 

And this makes sense.  The central banks will raise rates to rise back to more normal levels as economic growth takes hold.     


Additional Asset Class Detail


US Bonds


With a rating of 1 on the resilience scale, the US 10y Treasury yield is moderately vulnerable to declines. I expect this condition to remain in place for the next few weeks. The Micro Market Resilience Index suggests resilience, while the Macro and Exceptional Macro continue to suggest vulnerability.

The US 10y Treasury Futures (TY1) is rated 1, based on the Macro MRI. It lost the Exceptional Macro MRI for the week of 9/2/2016. I expect the Micro MRI to be present over the next week or so.
                                                                                            
US high-yield bonds continue to be rated 3, or highly resilient. All else being equal, high-yield bond prices will tend to rise. The rating may drop over the next few weeks to 2, when the Micro MRI ceases to be positive.

Developed Market Stocks


US industrial stocks, as represented by the Dow Jones Industrial Average, dropped to a rating of 1 this week. It lost the Exceptional Macro MRI this week, which is a notable shift. While this shift may be temporary, Focused 15 Investing portfolios are more defensive this week. 
                                                                                                
UK stocks are rated 2 this week, down from 3 as expected. 

European stock prices have a rating of 2. At the moment, it appears that this rating will remain in place for a few weeks.


Commodities


Overall, commodity prices are resilient with a rating of 3, up from 2 last week.

The S&P Goldman Sachs Commodity Index represents a basket of commodities, with a high weighting in crude oil. Crude oil (not shown in graphic above) continues to have a rating of 3. Please note that crude is a volatile asset and can differ meaningfully week to week from its MRI ratings. Over long periods of time, however, the ratings result in profitable trades.

Gold has a rating of 2, moderately resilient. There may be near-term price softness, but the Macro and Exceptional Macro MRI continue to be positive, and prices are likely to be resilient mid-to-longer term.
                                                                                                    
Emerging Markets


Emerging market stock and bond prices are rated moderately resilient. At the moment, this appears to be a temporary breather because the Macro and Exceptional Macro Market Resilience Indexes are both positive.

Chinese stocks, as represented by the Shanghai Composite, have a rating of 0, which suggests vulnerability to declines.

Currencies


The Dollar index, DXY, is rated 0 and is vulnerable to declines. This is noteworthy considering concerns about rising rates in the US, which would typically lead to a stronger USD. We will be watching this conflicting signal.

The Euro is rated 3, but may this rating may be short lived; we may see a rating of 2 in the next week or so. Regardless, EURUSD may continue to appreciate because of the positive Macro and Exceptional Macro ratings.

GBP is rated 2, which means it is moderately resilient. This is a new rating and suggests a positive shift – it was rated 0 just a month ago.