

Week of 10/17/2016 – Market Resilience Index Ratings
Both the US stock and bond markets have been
through a period of heightened vulnerability over the last several weeks. As expected, bonds (as measured by TY1) moved
to a higher rating this week.
The tables below show the Market Resilience Index
Ratings for both US 10y bonds and US stocks. The first table and chart focus on
US 10y bonds (TY1). The ratings have indicated low resilience (meaning moderate
vulnerability) for the last several weeks.
Trade Date
|
8/12/2016
|
8/19/2016
|
8/26/2016
|
9/2/2016
|
9/9/2016
|
9/16/2016
|
9/23/2016
|
9/30/2016
|
10/7/2016
|
10/14/2016
|
Bond Market Rating (TY1)
|
2
|
2
|
2
|
1
|
1
|
1
|
1
|
1
|
1*
|
2
|
*
Likely to move to a rating of 2 over next few weeks.
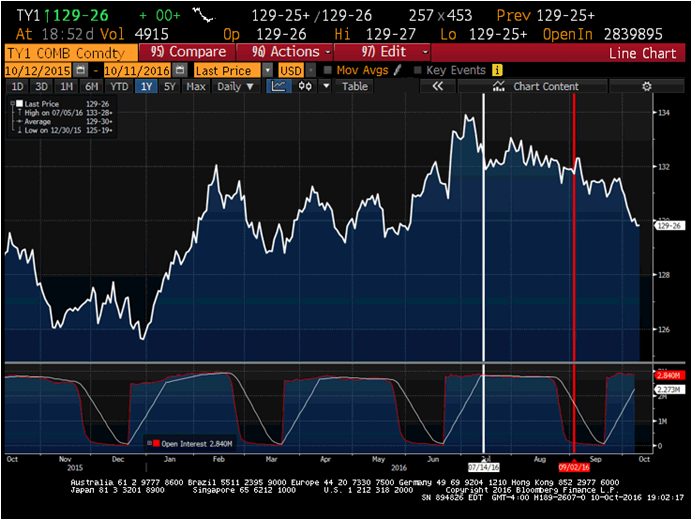
The recent price movements have not been large,
but there is some indication that prices have moved according to the resilience
measures. The screenshot below shows the
price of TY1 along with two vertical lines. The first line (white) shows when
the rating dropped to 2 from 3, effective 7/14/2016. This indicates that high
resilience had peaked. One can see that the prices peaked just before that
date. The second vertical line (red) shows when the rating dropped to 1 from 2,
effective 9/2/2016. One can see that prices softened after that time. The
minimum rating is 0, so there was still some resilience for bond prices. The
current reading, effective this Friday 10/14/2016, indicates stronger support
for bond prices. Thus, bond prices are likely to stabilize over
the next few weeks and could even move higher.
US stocks, as measured by the Dow Jones
Industrial Average, currently have a rating of 1 and may soon move to a rating
of 2. While an upgrade has not happened
yet, I expect it to take place within a few weeks. Of the 5000+ weeks since 1919, 84% of them have had Micro MRI levels
higher than the current reading. This
suggests that we are closer to the beginning of a strengthening of prices than
to additional price declines because of a lack of resilience. However, the resilience
reading is still low so there may be some near term declines.
Between now and that shift, we may have some
price dips that represent global stresses, but the duration of the dips is
likely to be short given that we see some modest level of resilience in a
number of equity markets globally. These
stock markets are rated 2 (moderately resilient) or 3 (resilient) for this
week: MSCI World, DJ Transports, NASDAQ, Russell 2000, UK Stocks, Emerging
Market stocks. These observations suggest that, barring major negative news or
events, US stock prices can reach new highs over the next month or so.
Commodities have the highest resilience of the
major asset classes right now.

The S&P Goldman Sachs Commodity Index represents a basket of
commodities with a high weighting in crude oil. Crude oil (not shown in
graphic) continues to have a rating of 3. Please note that crude is a volatile
asset and can differ meaningfully week to week from the MRI ratings. Over long
periods of time, however, the ratings result in profitable trades.
Gold has a rating of 2, moderately resilient. There may be near-term
price softness, but the Macro and Exceptional Macro MRI continue to be
positive, and prices are likely to be more resilient mid-to-longer term.
There are changes this week for currencies. The GBPUSD has a new
rating of 1, which means there is even less support for the GBP. It has already
fallen in response to Brexit concerns. The recent shift in vulnerability
suggests that value may continue to weaken; buying GBP right now is likely to
be premature.

The dollar index (DXY) has moved to 1 from 0, meaning that it now has
some resilience, although it is still at a very low level.
Overview of market resilience ratings for stock, bond and
commodity markets. #marketResilienceIndexes #marketOutlook #InvestmentResearch