7/15/2020

Weekly Note - July 15, 2020 - 2020 Recovery Version of Existing Model Portfolios

I have added a new portfolio that takes the place of the 2020 Recovery Portfolio (sg117) that I introduced a few months ago. Like the 2020 Recovery Portfolio (sg117) that it replaces, the new version gives a prominent role to the NASDAQ. The new 2020 recovery portfolio is a blend of a main model portfolio in the publication and the original 2020 Recovery portfolio (sg117). It includes not only a DJIA-linked ETF (like virtually all Focused 15 portfolios) but also a NASDAQ-linked ETF.

The new recovery portfolio version is labelled:

  - Diamond-Onyx 35-65 Mix (Main) 2020 (sg218.2)

Note that the sg number for this new recovery portfolio ends in “.2” (point two) to distinguish it from the model portfolio “Diamond-Onyx 35-65 Mix (Main) - sg218” that it is based on. Also note that the portfolio name ends with “2020.”

Another feature of the new version is the omission of the ETF SHY (US Treasury 1-3 year bond ETF). Instead of trading SHY, one simply holds that same amount of money uninvested in one’s account – the amount being indicated as “Cash (no ETF)” in the weekly target weights. This omission of SHY allows the addition of the NASDAQ-linked ETF without increasing the number of ETFs.

Below is a diagram that compares Diamond-Onyx Mix (sg218) and the new 2020 recovery (sg218.2) version.


The maximum exposure to sleeves (green boxes) with the high-volatility equity indexes (DJIA and NASDAQ) is the same—35 percent for both the main model portfolio and its 2020 recovery version. In the recovery version, the NASDAQ occupies a share of that 35 percent. There is a “minimum” of 65 percent allocated to the Onyx sleeve (yellow boxes) of the portfolio. The values shown in the Onyx sleeve are the neutral positions for those ETFs. The weekly target weights for all ETFs vary over time.

Why NASDAQ Was Not Used Earlier

A reasonable question is why NASDAQ was not included in the original Focused 15 Investing model portfolios. In the period 2007 to 2010, when the MRI approach was developed, NASDAQ’s history was just 36 years (beginning in 1971) and much of that history was dominated by the internet and technology boom of the 1990s and the following bust in 2000.

The MRI did a reasonable job navigating that boom and bust, but it was just one major cycle in the historical record, and therefore I was not able to conclude with confidence that the MRI approach was successful for NASDAQ in general. By comparison, the DJIA has usable history back to 1918 and has had many booms and busts during that time. The MRI did a good job of navigating them, which gives greater confidence in the DJIA signals.

But now, we have had additional valuable experience with the MRI and NASDAQ. Not only have the MRI handled the NASDAQ well for the period prior to the 2007-2009 financial crisis, but also the years though 2020 (thus far).

When we are well past the pandemic, we may see that the there is a place in the main portfolios for a NASDAQ ETF, or we may find that we can revert to using just DJIA. That decision, however, comes later – perhaps many quarters from now.

Additional Thoughts on SHY

In my own investing and from discussions with subscribers, I see that people favor trading fewer ETFs. As you may know, many of the model portfolios use the ETF SHY, which is for 1-3 year Treasury bonds, and is our most conservative ETF. From 2000 to 2010, SHY had an annualized return of 3.9%. This is a good return for a very low risk investment. However, from 2010 to 2020, SHY had an annualized return of 1.2%. The Fed has recently said that it will keep interest rates low for the foreseeable future and this decision means that the return of SHY may stay low. For us, it may not be worth the effort to SHY for the next few years. Thus, the new portfolio does not use SHY – instead the same amount of money is simply held in your account uninvested. This amount is indicated as “Cash (no ETF)” in the target weights. If interest rates move higher, we can switch back to using SHY.

5/27/2020

Weekly Note - May 27, 2020

The shortest cycle of resilience (the Micro MRI) continues to be in the up-leg of its cycle. Last Friday, it was at the 90th percentile of all levels since 1918. The prior Friday it was at the 85th percentile. With strong price moves yesterday (Tuesday the 26th) and today, this week may mark another move higher. Over the last one hundred years, there have not been prominent cases in which the Micro MRI simply continued going higher for several weeks after being at this high level. Instead, the Micro MRI moves to the down-leg of its cycle and prices tend to follow it lower.

In the main relief rally during the 2007-2009 Global Financial Crisis, the Micro MRI peaked around the level of the 85th percentile. This is good reference point, but is not a hard and fast rule for the current time.

We can think of the current high level of the Micro MRI as meaning the stock market moving into peak short-term optimism: good news is recognized by the market and bad news is not. This sentiment is likely to change soon and will be associated with increased pessimism and a lack of support for higher prices, all else equal.

These resilience conditions are not isolated to the DJIA. Stock markets around the world are also at the upper ranges of their Micro MRI cycles. You may recall from my discussions of the Focused 15 Investing approach that geographic diversification tends not to be useful in a global crisis. These other stock market indexes around the globe have Micro MRI levels very close to those of the DJIA, and my comments above apply to them as well.

  DJIA – US Blue Chip Stock: Micro MRI: 90th percentile

  S&P 500 – US Large Company Stocks, Broad coverage: 87th percentile

  UK Stocks: 69th percentile

  Europe Stocks: 84th percentile

  Japan Stocks: 94th percentile

  Emerging Market Stocks: 89th percentile

The following markets are also moving toward the peaks of their Micro MRIs, but have levels that are not as high as those listed above.

  Russell 2000 – US Small Company Stocks: 67th

  NASDAQ (Biased toward technology stocks): 45th

None of these eight major stock indexes has sources of resilience right now other than the Micro MRI. Neither the Macro MRI nor the Exceptional Macro MRI is providing resilience, making all these indexes precarious in terms of holding on to stock market gains.

Historically, the DJIA has dominated the price trends and conditions of other markets. This means that the MRI-based signals for the DJIA tend to explain the price movements of other stock markets. Yet the MRI signals of other markets tend to have little explanatory power for the price movements of the DJIA. This has been especially true in global crises when all stock markets become highly correlated. Thus, the resilience conditions of the DJIA are more important than those of the others. In today’s environment, the greater upside for the NASDAQ (as indicated by its Micro MRI being at only the 45% percentile) and its recent price strength may be the best case supporting continued stock market moves higher. But historically, the condition of the DJIA seems to overpower the other markets. The algorithms reflect this dominance of the DJIA.

Raising Cash Recently to Preemptively Become More Defensive

A few weeks ago, I gave guidance to raise cash. This was the first time I have taken this step since the beginning of Focused 15 Investing. It had the effect of bringing forward in time by about one week the more defensive positions that the algorithms were moving toward. The algorithms are intended to identify the peak and troughs of the MRI cycles. In the case of relief rallies (like the current one), prices move higher based on just one MRI – the Micro MRI. When that one MRI ceases moving higher, prices can drop quickly, all else equal. In addition, we trade on Fridays, and prices, of course, do not always peak on a Friday. Given the large potential losses and the small potential for gains as the Micro MRI moves toward its peak in a relief rally, raising cash has been prudent, even though it may not have added return over this period. Going forward, I plan to do the same in similar resilience conditions.

This Week’s Target Weight Changes

This week, the algorithms caught up with the more defensive stance of last week. In other words, the allocations to DJIA-linked ETFs have been reduced. Thus, we can reduce our cash levels in Box #2 of the Shares-to-Trade Worksheet to the normal 3%. The net effect will be only a small adjustment to the weights of the ETFs in your account.

If the Defensive Positioning of Our Model Portfolios is Wrong

In the event that our algorithms become out of sync with the market, they will recalibrate. As mentioned, the Micro MRI is still in its up-leg. If stock prices continue to move higher once the Micro MRI moves to the down-leg of its cycle, our framework would describe the market as being driven by news-of-the-day events, which would include optimism about the economic reopening and the massive economic stimulus.

These news-of-the-day effects would be compensating for the market’s lack of inherent resilience. Should these effects more than compensate for upcoming period of "least resilience," the algorithms will recalibrate. This recalibration would take place in a few weeks (as opposed to months) and would likely result in the Macro MRI and Exceptional Macro MRI beginning the up-legs of their cycles and providing resilience. These, in turn, would cause a change in our target weights.

Update of Potential Market Patterns for Coming Period of Least Resilience

Below, I update the charts I introduced in last week’s note. I have added a fourth pattern depicting the market moving higher when market resilience is at its lowest. In addition, I am listing these patterns in order of my subjective view of their probability (highest to lowest) based on historical norms – not any assessment of the current stimulus or reopening plans. Keep in mind that as of this week the Micro MRI is still moving higher and has not peaked. The period described below relates to the period after the peak of the Micro MRI.

A: Typical Market Pattern

The image below shows a typical pattern for a period of least resistance. Soon after the Micro MRI peaks and marks the beginning of the period of least resilience, the DJIA starts to decline. In this pattern, prices decline at the beginning of the period – and the initial decline can be abrupt. Then prices move lower consistently over the period. Moving out of the DJIA at the beginning of the period is the most successful strategy.


B: Delayed-Decline Pattern

In the delayed-decline pattern, rather than a consistent decline over the period, the major decline occurs at the end. A good strategy for this pattern is to be out of the market prior to the decline. The peak of the Micro MRI at the beginning of the period is the clearest and most reliable signal to get out of the market. While doing so at that time seems premature, it is the most effective strategy for this pattern. One should be patient with the defensive position while the market moves up and down without a large gain or loss prior to the larger decline at the end of the period.


C: Flat Pattern

The flat pattern typically occurs when there is an abundance of good news in the marketplace and stock prices remain at roughly the same level over the four to twelve weeks of this phase of the cycle. Prices move higher temporarily on any good news, but the market does not hold on to those gains. In this pattern, staying in the market or moving out does not have a big impact on returns over the period.


D: Prices-Move-Higher Pattern

In the prices-move-higher pattern, good news overwhelms the lack of resilience in the market. Prices move higher because of that good news. In the current environment, the massive economic stimulus by central banks around the world could provide the overwhelming good news. However, our bets are based on resilience, not an assessment of the magnitude of good or bad news. We will miss the gains of this period. The algorithms treat this pattern like it is the “delayed decline” pattern to avoid the decline at the end of the period. If prices do move higher, the pace is not likely to be as steep as when the Micro MRI is ascending. If this pattern takes place, the algorithms will respond quickly (in a few weeks) to it and move assets into the stock market as Exceptional Macro MRI starts to emerge. (See discussion above about how the algorithms respond when news of the day overwhelms vulnerability conditions.) I can usually see Exceptional Macro MRI starting to emerge and may be able to alert subscribers to this situation.


End

5/20/2020

Weekly Note - May 20, 2020

The DJIA is close to the peak of its Micro MRI. As of last Friday, it was at the 85th percentile of all levels since 1918. After it peaks and ceases to provide resilience, the DJIA will be “least resilient,” meaning that none of the MRI (Micro, Macro, Exceptional Macro) are in the uplegs of their cycles. For the subsequent roughly 4 to 12 weeks, the market will be very vulnerable to declines. In the absence of very good news, prices are likely to decline.

I’d like to show you a few alternative patterns for what the market may do during this period of least resilience.

Pattern A - Typical

The image below shows a typical decline (a). Soon after the Micro MRI peaks and marks the beginning of the period of least resilience, the DJIA starts to decline.


In this pattern (above), prices decline at the beginning of the period – and the initial decline can be abrupt. Then prices move lower consistently over the period. Moving out of the DJIA at the beginning of the period is the most successful strategy.

Pattern B - Flat

The second pattern (b) is when there is an abundance of good news in the market place and stock prices remain at roughly the same level over the 4 to 12 weeks. Prices move higher temporarily on any good news but the market does not hold on to those gains.


In this pattern, staying in the market or moving out does not have a big impact on returns over the period.

Pattern C - Delayed Decline

The third pattern is a delayed decline (c). Rather than a consistent decline over the period, the major decline occurs at the end of the period.


A good strategy for pattern c is to be out of the market prior to the decline. The peak of the Micro MRI at the beginning of the period is the clearest and most objective signal to get out of the market. While doing so at that time seems premature, it is the most effective strategy for this pattern. One should be patient with the defensive position while the market moves up and down without a large gain or loss prior to the larger decline at the end of the period.


Historically, patterns a and c are most common and create large losses. Pattern b is less common. The Focused 15 Investing strategy is to get out of the market on vulnerability. If pattern b prevails, we might miss some of the positive returns but in doing so we avoid the risk that what initially looks like a b pattern is actually a c pattern. Since the losses in a and c can be very large, getting out of the stock market is the more prudent course of action.

The Current Situation

In the current situation, we are clearly at a very high level in the Micro MRI and will soon begin a period of least resilience (none of the MRI in an upleg) and we are moving out of the stock market. Raising cash over the last few weeks has been a preemptive action to avoid the abrupt declines typical of pattern a.

There is good news in the marketplace that will be influencing returns. The Fed and its counterparts around the world have pledged to do whatever it takes to heal the economy and protect investors, countries are reopening, and potential game-changing cures and vaccines make the news. As for bad news, record unemployment, an emerging wave of bankruptcies, and prolonged social distancing all create a drag on the economy and stock prices.

Since we don’t try to determine the impacts of the current news and we move out of the stock market on vulnerability, we are preparing for patterns a and c. We will see after the fact if either of these patterns were relevant. If it turns out that pattern b is most relevant, we may have taken these steps simply as a precaution.

Looking Forward

At the end of the period of least resilience (at the next market bottom), the market will likely move higher dramatically regardless of the pattern during the period of least resilience. As the market passes through the market bottom, it will become more resilient and it will then be appropriate to be more aggressive.

4/29/2020

Weekly Note - April 29, 2020

This is likely to be the last week of the “Wait & Prepare” season. At the end of this week, we are likely to shift to a Harvest season.

I continue to believe a less aggressive stance for your account is appropriate for the reasons reviewed below.

Market Context

As of today (April 29), the relief rally is continuing to push stock prices higher. I do not expect the recent pace of price appreciation to continue for long. As you know, last week I gave the first-ever guidance to reduce account aggressiveness by raising cash or switching to a less aggressive model portfolio. While as of today, reducing account aggressiveness has caused us to forego some returns, I continue to believe the less aggressive stance is appropriate.

Over the next week or so, investor sentiment will likely become more negative than the optimism we currently see in the stock market. As you may recall, I have mentioned that I would issue alerts, if needed, outside of the regular midweek communication schedule. I may take this step over the next weeks, but I believe the step of proactively reducing account aggressiveness will give us some flexibility around that alert and the implementation of guidance at that time.

The comments below describe the reasons for the special guidance issued last week. No new special guidance is provided below.

The Micro MRI is Moving into the Upper End of Its Cycle

As of last Friday, the cycle of short-term resilience, the Micro MRI, was at the 63rd percentile of levels over the last 100 years. It was at an extremely low level (9th percentile) just six weeks ago. A key question is: At what level does the Micro MRI for the DJIA stop moving higher and cease to provide resilience?

I estimate that during the Global Financial Crisis of 2008-9, all three of the relief rallies during that time period had Micro MRIs that peaked at levels just a week away from last Friday’s reading (assuming the average weekly Micro MRI move over the last 100 years). Of course, this time it could be different, but I believe extra caution is justified considering the magnitude of the economic problems the pandemic is causing.

Indexes that Move Opposite to Stocks are At the Lower Ends of their Micro MRI Cycles

Three indexes – namely, the US 10y Treasury bond index, a series called VIX, and credit spreads -- all have Micro MRI that are in the down-legs of their cycles and are at the lower ends of their historical ranges. These indexes move opposite to stocks; their MRI tend to move down when stocks go up (and vice versa). The indexes have been in the down-legs of their cycles for the last 6 weeks, consistent with increases in the stock market that we have experienced. The Micro MRIs for these three indexes are now at very low levels. The US 10y Treasuries Micro MRI is at the 25th percentile. VIX, a popular measure of the stock market’s expectation of variability based on S&P 500 index option (Link: https://en.wikipedia.org/wiki/VIX), has a Micro MRI that is at the 4th percentile. The credit spread index I use has a Micro MRI at the 25th percentile.

These statistics mean that these three indexes are close to beginning the up-legs of their MRI cycles. When they do stocks are likely to move lower. This information supports the view that the Micro MRI for the DJIA is at the upper end of its cycle.

Relief Rallies have Narrow Peaks, Often Occurring on a Single Day

As with other relief rallies in market history, the current relief rally is based exclusively on the up-leg of the Micro MRI – none of the other MRI are in the up-legs of their cycles and, therefore, none are providing resilience. Relief rallies tend to peak on just one day, whereas rallies based on the longer-term Macro MRI tend to have multiple peaks at similar levels over the course of several weeks or months. This means that stock prices in a relief rally tend to move higher quickly, then peak on one day, and then decline. Since the current rally has performed in a manner consistent with this general pattern thus far, I believe it is prudent to reduce aggressiveness in anticipation of the peak in the Micro MRI and hence the relief rally.

As mentioned in prior notes, extraordinarily good news, such as an effective vaccine and a fast economic recovery, could limit the stock market declines after the Micro MRI peaks. Based on historical patterns, stock prices may be flat during periods that have both no resilience and very good news, but it would be very unusual for prices to continue moving higher during a period of no resilience. As you know, the Focused 15 Investing approach does not make bets based on the assessments of such news.

For these reasons, I took the unusual step of suggesting to reduce account aggressiveness. I suspect this guidance will be in place for several weeks.

4/23/2020

Update April 23, 2020

This note updates information I sent out last night (April 22).  I have continued to review the MRI conditions of major market indexes today and want to refine yesterday’s guidance.   

As mentioned yesterday, my best estimate is that the relief rally will end within a week or two.  As it ends, a meaningful price decline is likely.  When the Micro MRI peaks and ceases to provide resilience, the stock market will no longer have any resilience from any of the three main sources (the Macro, the Exceptional Macro, or the Micro).  Thus, the market will be considered as “LEAST resilient.” 

I am quite confident of this view – the math behind the MRI is unlikely to allow any resilience measure to become positive for at least several weeks.  In addition, this view is supported by the MRI of other index series that are often related to stock price declines (e.g., US 10y bond index, VIX, USDJPY, CHFUSD). 

The depth of the price declines during this “least resilient period” will depend on the magnitude of bad news we encounter.  Considering that the global economic system has come to a virtual halt, it seems that the potential sources of bad news are plentiful.  There are also potential sources of good news that can counter-balance the bad news. These include the unprecedented economic stimulus around the world, possible medical breakthroughs related to vaccines and/or testing, and measures of unexpectedly fast economic recovery. 

However, as you know, I don’t try to assess the magnitude or market impact of good or bad news.  Instead, we rotate our accounts based on resilience alone.  While the relief rally began and moved higher as expected in the MRI resilience framework, as we move closer to the end of the relief rally, I do not believe we should wait for the algorithms to identify the end of rally in this global economic shutdown.   

For all subscribers, even those with long time horizons, I suggest the following steps:

   1.  For Trading on Friday April 23, 2020: Do “a” or “b” below:
       a. Raise cash by, say, 30%.  For example, if you currently have, 3% in Box #2 of the Shares-to-Trade worksheet, enter 33%.  If you currently have 5%, enter 35%.  This is probably the easiest technique for reducing account aggressiveness and can be adjusted easily over time. 

       b. Switch to a less aggressive model portfolio.

   2. At a later date (which I will identify and alert you about): Consider switching to the “Onyx Special 2020 Recovery (sg117)” model portfolio. I designed this portfolio for an extended period of social distancing. It holds technology, consumer staples, and healthcare stock ETFs.  These sectors have been strong since the beginning of the epidemic and a good case can be made that they will continue to do well when social distancing is prevalent.  We will get a better idea of the value of this portfolio after we see stock price behavior when the stock market is least resilient.

Options a & b are described in the link:  https://marketresilience.blogspot.com/p/changing-portfolio-aggressiveness.html

Of course, you can raise more or less cash if you prefer.  Also, I suspect that some subscribers with long investment horizons may decide not to raise cash at this time. 

I continue to expect the second bottom of the W-shaped recovery pattern to occur in the May through July period.  June may be the most likely.  Also, I cannot determine at this time if the second bottom will be shallow or deep. 

Please contact me at any time with questions!

- Jeff

4/22/2020

Weekly Note - April 22, 2020

IMPORTANT – PLEASE READ

The stock market as measured by the DJIA is still displaying the effects of the upleg of the shortest cycle of resilience - the Micro MRI.  The Micro MRI’s level as of last Friday was at the 52nd percentile of levels since 1918, which suggests that short-term resilience may be in place for another week or two, and the relief rally may last about that long as well.

Considering that we are close to the peak of the relief rally, it is time to review where we are with respect to containing the pandemic.  A vaccine is many months – perhaps over a year – away.  Widespread testing for antibodies is also many months away.  While a month ago, there was talk about the shutdown lasting a few weeks, widespread relaxation of social distancing does not appear to be at hand.

Rather than wait for the end of the relief rally as indicated by the MRI, I think it is prudent for subscribers to identify the way they would like to reduce the aggressiveness of their accounts and begin to make the changes. I do not believe that changes must absolutely be completed this week (Friday).  But use the next few days to review the options and contact me with any questions about the model portfolios, changing aggressiveness, and the mechanics of making changes.

Over the last month I have described the options for reducing aggressiveness and they are:
  1. Raise cash by, say, 30%.  For example, if you currently have, 3% in Box #2 of the Shares-to-Trade worksheet, enter 33%.  If you currently have 5%, enter 35%.  This is probably the easiest technique for reducing aggressiveness and can be adjusted easily over time.  
  2. Switch to a less aggressive model portfolio.
  3. Switch to the “Onyx Special 2020 Recovery (sg117).”  I designed it for an extended period of social distancing. It holds technology, consumer staples, and healthcare stock ETFs.  These sectors have been strong since the beginning of the epidemic and a good case can be made that they will continue to do well when social distancing is prevalent.  
Options 1 & 2 are described in the link:  https://marketresilience.blogspot.com/p/changing-portfolio-aggressiveness.html

Of course, you can stay with your current model portfolio if you prefer.  I suspect that subscribers with very long investment horizons may decide to do this.

I continue to believe the W-shaped market recovery pattern is most likely.  We won’t know until we go through it if the second bottom will have a shallow bottom (with no or minimal stock market price declines) or a deep one (with large market declines).  Our strategy will be the same either way – reduce aggressiveness by taking money out of stocks.  At some point over the next few months (I hope) the stock market will be much more resilient and we can unwind the changes discussed above.

4/15/2020

Weekly Note - April 15, 2020

The target weights call for an increase in the allocation to stocks.

Current MRI Conditions

Stock prices have moved sharply higher over the last few weeks in a classic relief rally. The Micro MRI has been the only MRI providing resilience during this period. Since the Macro and Exceptional Macro are not currently providing resilience (and are not close to doing so) prices will likely again decline when the Micro MRI peaks in just a few weeks. This will be the end of Upleg A described below.

The Micro MRI has moved from a historically low level at the end of March and is now about the 45th percentile of all levels since 1918. This means that we are about halfway through the normal upleg of the Micro MRI. If we get a few weeks of positive returns, the Micro is likely to be at its peak.

As you can guess, staying invested in the stock market when we believe we will have another leg down is a white-knuckle time. While the MRI have historically done a good job of identifying the end of relief rallies, waiting to see if this will occur again is tense. As mentioned a few weeks ago and also below, I may issue a special alert to reduce account aggressiveness outside of the regular midweek publication if the market conditions deteriorate.

However, if you are losing sleep, you can reduce aggressiveness using the methods described on this page.  Link:   https://marketresilience.blogspot.com/p/changing-portfolio-aggressiveness.html

I believe you be able to make up for any lost return after the second bottom of the W. At that time, there may be more support from the MRI. Please contact me for clarification if needed.

I cannot determine at this time if the second bottom in the W will be as low as the first bottom on March 23 or more shallow. If the second bottom is shallow (meaning prices do not go as low as they were on March 23rd), the buying opportunity at the second bottom will not be as attractive as the first bottom in terms of price. Some subscribers added to their accounts at the first bottom. However, waiting until the second bottom to add additional money to your investment account is probably less risky - at that time there should be far greater market resilience than there has been over the last few weeks.

End of Plant Season

Last week was end of the Plant season. We are currently in a Wait & Prepare season. In a few weeks, we will be in the Harvest season, which may be short this time around.

Market Recovery vs. Economic Recovery Patterns

You may hear on the news about V-shaped or U-shaped recoveries. In some cases, these are referring to the pattern of economic recovery as opposed to market recovery. Regardless of whether we have a V or U-shaped economic recovery, I believe that for the market recovery the W-shaped pattern continues to be most likely.

- Jeff

--------------

2020 Recovery Plan – Repeated from April 8, 2020 (with minor revisions)

The phases and steps described below are most applicable for people with investment time horizons less than, say, 7 years. For people with longer investment horizons, staying with your original model portfolio is reasonable through all these phases.

I have written that the W-shaped market recovery is most likely in this current situation. The graph below shows my estimate of where we are now. The graph is unchanged and the statements have been edited for clarity.  New statements are in italics.

2020 Recovery Plan


Decline #1

Step One – First Bottom: Move to the target weights of your selected model portfolio. DONE: The alert indicating the first bottom was issued on March 25.

Phase 1 – “Upleg A” to the Peak of the Relief Rally

During this phase, adhere to the target weights of the model portfolio you used during the recent major decline. But this is not the time to try to make up for earlier declines by being more aggressive.

Step Two – Peak of the Relief Rally: I will notify subscribers when I think we are near the peak of the rally and assess the target weights of the main model portfolios. If needed, I will issue a special alert to reduce the aggressiveness of your account outside of the normal midweek note and Friday trading schedule. See this link for more information on changing the aggressiveness of your account. (https://marketresilience.blogspot.com/p/changing-portfolio-aggressiveness.html)

During this phase, review the “Onyx Special 2020 Recovery (sg117)” model portfolio prior to the peak of the Relief Rally at the end of Upleg A. I designed this portfolio to be conservative but to invest in stocks that are likely to benefit from an extended period of social distancing. It invests in technology companies, consumer staples companies (think toilet paper and toothpaste), and healthcare companies. We can think of it as the technology and toilet paper portfolio, or TnT. I have placed the prior content on a separate page with a new link: https://marketresilience.blogspot.com/p/addition-of-special-variation-of-onyx.html

Phase 2 – “Decline #2” After the Relief Rally

Maintain a less aggressive stance (using a less aggressive model portfolio or the Onyx Special 2020 Recovery sg117 model portfolio) in your account until the second bottom. If the pandemic and economic situation deteriorates further, the less aggressive stance will be appropriate for a longer period of time.

Phase 3 – Upleg B and Beyond

Step Three - At the Second Bottom - Switch back to your original model portfolio and/or reduce cash in your account to resume the original level of aggressiveness of your account. This is the buying opportunity you don't want to miss. When we get to this time, you can also consider switching to a model portfolio that is more aggressive than the one you used during the decline.

4/08/2020

Weekly Note - April 8, 2020

The markets are closed this Friday so any trading should take place Thursday (tomorrow) or Monday.

I have made a few important refinements to the weekly publications over the last few weeks and these are summarized in this link:
https://marketresilience.blogspot.com/p/i-have-adjusted-and-model-portfolio.html.
Please contact me if clarification if needed.

We have technically been in a Plant season, although the sense of crisis has overwhelmed the last several weeks. For those with a long investment horizon, this has been a good time to add money to your account. Some subscribers are doing so. The second bottom, described below, is likely to have clearer buy signals from the MRI. However, we cannot tell at this time if the second bottom will be lower or higher than where the market is now.

The comments below show where we are in the W-shaped recovery pattern and briefly discuss the recent refinements to the model portfolio lineup in the weekly publications. Links provide additional detail.

2020 Recovery Plan

The phases and steps described below are most applicable for people with investment time horizons less than, say, 7 years. For people with longer investment horizons, staying with your original model portfolio is reasonable through all three phases (1,2, and 3).

I have written that the W-shaped market recovery is most likely in this current situation. The graph below shows my estimate of where we are now.

2020 Recovery Plan – A W-shaped Market Recovery Pattern Appears to Be Most Likely

Decline #1

Step One – First Bottom: Move to the target weights of your selected model portfolio. DONE: The alert about the first bottom was issued on March 25.


Phase 1 – “Upleg A” to the Peak of the Relief Rally

We are currently seeing a rally in stocks, which I believe is most likely a relief rally or bear market rally. During this phase, adhere to the target weights of the model portfolio you used during the recent major decline. We appear to be midway through rally.

Step Two – Peak of the Relief Rally: I will notify subscribers when I think we are near the peak of the rally and will assess the target weights of the main model portfolios. I may give additional guidance to reduce the aggressiveness of your account. See (https://marketresilience.blogspot.com/p/changing-portfolio-aggressiveness.html) for more information on changing the aggressiveness of your account.

Prior to the peak of the relief rally, review at the following link the description of the refinements to the model portfolio lineup. This blog page gives an overview of the recent changes that will make managing the aggressiveness of your account easier as we move through the market recovery. Please note the description of the new "Onyx Special 2020 Recovery (sg117)" portfolio. I have designed this to be used in the case of a long period of economic weakness related to pandemic, social distancing and related economic weakness.  Follow this link and go to the last section of the post:
https://marketresilience.blogspot.com/p/i-have-adjusted-and-model-portfolio.html

Phase 2 – “Decline #2” After the Relief Rally

Maintain a less aggressive stance in your account until the second bottom. If the pandemic and economic situation deteriorates further, the less aggressive stance will be appropriate for a longer period of time.

If the pandemic and economic situation improves more quickly, decline #2 may be muted. If the situation improves greatly, the W-shaped market recovery patten could morph into a V-shaped pattern. We will get a better perspective on this several weeks from now.

Phase 3 – Upleg B and Beyond

Step Three - At the Second Bottom: Switch back to your original model portfolio and/or reduce cash in your account to resume the original level of aggressiveness of your account. This is the buying opportunity you don't want to miss. When we get to this time, you can also consider switching to a model portfolio that is more aggressive than the one you used during the decline.

4/02/2020

Weekly Note - April 2, 2020

I believe we will be in a more protracted economic hibernation than seemed likely just two weeks ago. I outline my understanding of “Virus Time” in the link below on Three Scenarios.

With this extended timeline, it may make sense for some subscribers to reduce the aggressiveness of their accounts while we move through the early parts of the slowdown, even if we have not reached the end of Upleg A as I describe below. 

This note discusses:
  • Where we are in the “W-shaped” market recovery pattern
  • A review of recent model portfolio performance compared to the DJIA and funds offered by Vanguard and the Russell Investment Group.
  • Additional research notes.  These are not required reading but will give you an idea of things I have been working on.  These include notes about three different economic scenarios, a brief comment about responding to rapidly appearing signals outside of our regular weekly trading pattern, and a few additional points about valuation changes in past declines.

The W-shaped Market Recovery Pattern

In my earlier note (https://marketresilience.blogspot.com/2020/03/update-march-22-2020.html) I described the W-shaped pattern as the most likely.  I continue to believe that is the case.  I believe we have already experienced the first bottom of the W and are now in “Upleg A” mentioned in the earlier post.  It appears that Upleg A may continue for a few more weeks.  However, the DJIA may move down toward the level of the first bottom before it ends higher - the path is not always higher each week. The second bottom is likely to occur May through July; this is the buying opportunity you should take advantage of.

Below are recommended steps for moving through these points in the W-shaped recovery pattern.  These steps are most applicable for people with investment time horizons less than, say, 7 years. For people with longer investment horizons staying with your original model portfolio is reasonable through all these steps:
  1. First Market Bottom – If tolerable, move to the target weights of your selected model portfolios. DONE: The alert about the first bottom was issued on March 25.
  2. At the End of Upleg A – This occurs at the middle peak in the W. When this time comes, consider reducing aggressiveness of your account by increasing the amount of cash in your account (increase the amount in Box #2 on the Shares-to-Trade worksheet), or switch to a model portfolio to the left of the one you have been using. See (https://marketresilience.blogspot.com/p/changing-portfolio-aggressiveness.html) for more information on changing aggressiveness. 
    • We are currently prior to the end of Upleg A.  Based on the likely scenario I link below, our period of high economic uncertainty and damage will continue for several months. Bad upcoming mortality and economic headlines will probably dampen the relief rally over the coming weeks. This makes identifying the precise end of Upleg A more difficult. If the uncertainty and variability of the current situation are intolerable, you can reduce the aggressiveness of your account and still have time to move to a more aggressive stance as the markets and economy emerge from hibernation.  Of course, you are free to use any model portfolio on the publication at any time. 
    • I will still try to identify the end of the relief rally as described above.  
  3. Second Bottom – At this point switch back to your original model portfolio and/or reduce cash in your account to resume the original level of aggressiveness of your account. This is the buying opportunity you don't want to miss. When we get to this time, you may see that moving to a model portfolio that is more aggressive than the one you used during the decline is appropriate.

Recent Model Portfolio Performance

The link below shows how popular Focused 15 Investing model portfolios performed over various recent time periods. The tables show that even though the declines were significant, the Focused 15 approach still performed favorably compared to the alternatives listed. https://marketresilience.blogspot.com/2020/03/update-march-26-2020-not-urgent.html.  

Ongoing Research

This section is not required reading, but some subscribers might be interested in these comments. As an exercise, I am evaluating three different scenarios for the path ahead to determine what, if any, changes might be needed in our model portfolios to take advantage of them. https://marketresilience.blogspot.com/2020/03/covid-recovery-model-portfolio.html

I am also evaluating how I can reliably provide alerts that a change in the aggressiveness of your account may be appropriate.  I will discuss this more in a few weeks.

Finally, here is a link to additional information on changes in valuation measures in past declines.  This adds more depth than I was able to provide in my comment on valuation a few weeks ago. https://marketresilience.blogspot.com/2020/03/historical-valuation-comparisons.html


Please feel free to contact me with questions or comments.

Jeff

3/30/2020

Research Note: Historical Valuation Comparisons

March 30, 2020

Over the last few weeks, the DJIA declined significantly. The DJIA price level declined 37% from its peak on February 12, 2020 to the most recent low on March 23, 2020. Valuation measures can give us an idea of how far prices might fall near term by looking at changes in valuation levels in past declines.  My original note about valuation is in: https://marketresilience.blogspot.com/2020/03/update-march-22-2020.html, in the section titled: "The DJIA May Be in the Bargain Basement."

This note provides additional data.

Price-to-Book Ratio Changes in the Great Depression

The Price-to-Book ratio for major market sectors in during the 1930s declined from their highs in 1929 to about 50% of the prior high values by 1930.  This information comes from "The Crash and Its Aftermath: A History of Securities Markets in the United States, 1929-1933," by Barry Wigmore (1985).  The decline took place over a longer time than the recent Corona decline, and there may have been write-downs in book value during that longer period that make this comparison less meaningful.

As comparison, the Price-to-Book ratio of the DJIA declined to 2.9 as of March 22, 2020 from a high of 4.4 just a month earlier. This represents a drop to 66% of its prior high value.

Price-to-Earnings Ratio Changes in 1987

During the 1987 Crash the DJIA price level declined about 30% from August 25 to October 19. I can locate only Price-to-Earnings ratio information for this decline. Over the same time period, the DJIA's Price-to-Earnings ratio had declined to 67% of its prior high value.

This information is from the New York Times. https://www.nytimes.com/1987/11/27/business/economic-scene-taking-a-look-at-p-e-ratios.html

As a comparison, the DJIA Price-to-Earnings ratio declined to 65% of its prior high level from February 12, 2020 to March 23, 2020.

Summary

This information suggests that the recent decline has already produced low valuations, low enough by historical standards to attract bargain-hunting investors.  I believe the information in the original note linked above and this additional note is relevant for the immediate time period. Please note that earnings and book values will certainly change (decline) as a result of the pandemic and economic decline. As we start seeing additional deterioration in the real economy, other valuation assessments might be needed to give perspective.

As you know, the MRI-based process does not include valuation information because it is difficult to obtain accurate historical information.  But I do refer to it on a regular basis for market context, especially during times of market stress.

3/27/2020

Research Note: Three Market Scenarios and Possible Responses

As you may know, my views on forward looking scenarios do not have an impact on the target weights, but they do influence my review of portfolio designs as I evaluate whether there is a change in the economy or markets that requires a shift in their designs.  As an example, the recent price decline was a shock to many investors and affected their short-term risk tolerances. I adjusted the model portfolio lineup and my communication to make it easier to adjust the aggressiveness of one's account.

I am currently evaluating three different scenarios for the path ahead to determine what, if any, changes might be made to model portfolio design to accommodate scenarios more extreme than the one I consider most likely.

The Likely Scenario - Economic Activity Constrained to "Virus Time"

Current expectations:
  • Unemployment will spike dramatically over the near term and stay high for many months.
  • Bankruptcies will spike as well.
  • The Federal Reserve and its counterparts around the world have already stated emphatically that they will do “whatever it takes” to limit the damage of this crisis. Their actions have been consistent with their statements. Additional actions are expected.
  • Congress and the President have enacted stimulus packages and have promised more
  • Social distancing will continue in some form until a vaccine is developed in 12+ months. Until that time, travel and entertainment, dining out, and shopping for non-essentials will be severely limited.
  • Economic activity will begin to resume when there is an effective and scalable way to test for antibodies, which can identify people immune to Covid-19 who can safely return to work. The antibody test is some months away.
  • More people are working effectively at home than would have been possible a few decades ago or certainly during the Spanish Flu in 1918-9. Economic activity is continuing during lockdown, which may be the source of some positive surprises.   
  • The level of bad news in the market will likely be higher in the US when death rates spike over the next several weeks, employment reports come out, and the scale of the immediate economic damage becomes more apparent.  
  • Investors will see some light at the end of the tunnel as Europe moves through its curve of infection, mortalities decrease, and people return to work.  Asia is more advanced in that sequence. India and South America may be behind the US.  
Earlier than expected development of vaccines and antibody tests will accelerate this timeline and would be key events. 

The fact that we just recently had a major financial crisis (2007-9) with bailouts and stimulus packages is important to the current situation. The Global Financial Crisis was just over ten years ago as opposed to something we could only read about in history books. Many of the same people and institutions have been involved in both crises and I believe there is general dissatisfaction with how the past rescues of big corporations and financial institutions failed to benefit the consumer as much as needed. In the subsequent years, interest rates have been pushed lower and lower to encourage growth.

But the debt load carried by the economy has expanded (because of low rates) to the point where any increase in interest rates has a devastating effect on both corporations and consumers. We seem to have come to the end of the long trend toward lower interest rates that started in the 1980s when short term rate (2-year treasuries) was 16.7% in September of 1981 to the current rate of 0.23% (March 2020). While Japan has had negative interest rates for a few years, low rates distort corporate and individual investment and borrowing decisions.

This current crisis may be a way of clearing out the debt load and resetting debt loads and interest rates to a more healthy and sustainable relationship. Thus, the pandemic can be thought of as precipitating important changes that would have come about without the virus but in a perhaps slower and probably less comprehensive manner.

If this scenario is valid, our current lineup of model portfolios is likely to navigate the 2020 recovery reasonably well. The design of the current model portfolios is based on analyses of prior recessions and market crashes and their recoveries. Our portfolios emphasize the DJIA because of the quality and liquidity of the companies it contains. Should there be widespread bankruptcies in the broader market, the DJIA companies generally considered strong and some of the DJIA companies may actually grow stronger as they absorb customers from the competition. For reference, the top 10 holdings of the DJIA are:
  • Apple Inc
  • UnitedHealth Group Inc
  • Home Depot Inc/The
  • Goldman Sachs Group Inc/The
  • Visa Inc
  • McDonald's Corp
  • Microsoft Corp
  • Johnson & Johnson
  • 3M Co
  • Boeing Co/The
The DJIA has technology companies (Apple, Microsoft) and healthcare companies (UnitedHealth Group, Johnson & Johnson).

The model portfolios currently hold US 10y Treasury bonds also because of their quality and liquidity. In times of crisis, quality and liquidity make it easy to adjust our asset allocations and to remove money from the market. We do not hold corporate bonds because they may be difficult to trade in times of stress.

A More Positive Scenario

I can imagine a more positive outcome for the global economy from the current events. Many individuals and businesses will suffer and be forced into bankruptcy. In this scenario, the changes happen quickly. There will be some form of debt forgiveness, perhaps in the form of student loan forgiveness or mortgage relief. Reduced debt load among consumers and businesses and the global economic stimulus will encourage rapid economic growth. Fiscal stimulus will help rebuild infrastructure faster than would have otherwise occurred and provide future efficiencies. Surviving business will grow quickly with a lower debt load. In the next couple of years, we may begin to see hints of inflation.

If this scenario becomes more likely, it may be helpful to incorporate inflation-linked bonds as a component.  I have been running inflation signals sets since 2007 and can incorporate them if needed.

A More Negative Scenario

Even though we are seeing an extremely fast response from governments around the world, the inevitable economic contraction may be extremely difficult for many businesses and sectors of the economy. They will not muddle through easily. Individuals and business bankruptcies will grow more than expected right along with unemployment rate. Financial stress and dislocation will reverberate through the global economy for many quarters despite the speed and magnitude of the government response. Economic growth will not rebound evenly throughout the US or global economies.

I am evaluating variations of the current model portfolios that seeks to have more exposure to the parts of the economy that may benefit during the more negative scenario. I tentatively call it the 2020 Recovery model portfolio and its structure is based on the Diamond-Onyx Mixes. It uses existing signal sets (developed over 7 years ago), which makes the historical simulations far less vulnerable to back-fitting the solution to the time period just experienced.

The thrust of the modification is to have greater exposure to consumer staples companies, technology companies, and health care companies. These sectors may experience better growth than other areas of the market.

Consumer Staples companies tend to have steady business in difficult economic times. They may get a boost as more people eat at home and seek to make life at home comfortable and pleasant. We currently use the ETF XLP for Consumer Staples companies in the Onyx mixes.  The modification would increase the allocation to this ETF.  The top 10 holdings of this ETF are:
  • Estee Lauder Cos Inc/The
  • Mondelez International Inc
  • Coca-Cola Co/The
  • Procter & Gamble Co/The
  • Walmart Inc
  • JM Smucker Co/The
  • Altria Group Inc
  • Sysco Corp
  • Kraft Heinz Co/The
  • Archer-Daniels-Midland Co
The 2020 Recovery would obtain greater technology exposure by having an allocation to the ETF QQQ, which tracks the NASDAQ 100 index. The Nasdaq 100 Index is composed of 100 of the largest international and domestic companies, excluding financial companies, that are listed on the Nasdaq stock exchange, based on market capitalization. Therefore, QQQ is heavily weighted toward large-cap technology companies and is often viewed as a snapshot of how the technology sector is trading. The growth of online commerce, new technological solutions to address workplace challenges (e.g. remote working and online meetings and classes), the growing need to provide social connections in in a socially distanced world, and investment in new technologies to solve emerging problems will likely boost the NASDAQ. The top 10 holdings of QQQ are:
  • MICROSOFT CORP
  • APPLE INC
  • AMAZON.COM INC
  • ALPHABET INC-CL A & C
  • FACEBOOK INC-CLASS A
  • INTEL CORP
  • PEPSICO INC
  • CISCO SYSTEMS INC
  • COMCAST CORP-CLASS A
  • NETFLIX INC
As you can see, there is overlap with the DJIA.  Apple and Microsoft are among the top 10 holdings of both indexes and ETFs.

Health Care companies would be included in the Covid 2020 Recovery model portfolio.  They are likely to get a direct boost from consumer and government spending because of the pandemic. These companies might also be affected by changes in the healthcare system as we move through the recovery. Should this sector deteriorate as an investment, it may be removed from the model portfolio. We would have an allocation to the ETF XLV. Its top 10 holdings are:
  • Johnson & Johnson
  • UnitedHealth Group Incorporated
  • Merck & Co., Inc.
  • Pfizer Inc.
  • Abbott Laboratories
  • Bristol-Myers Squibb Company
  • Amgen Inc.
  • Medtronic Plc
  • Eli Lilly and Company
  • Thermo Fisher Scientific Inc.
It is important to recognize that the top holdings in the major indexes are similar; there is a fair amount of overlap. Thus, the change from the current structures may be less than it appears.  Please see this page for the holdings of the ETFs mentioned: https://marketresilience.blogspot.com/p/etf-holdings.html

The resulting model portfolio has similar characteristics of the Onyx mixes currently offered, although it holds more ETFs. While the design of the existing model portfolios considers a very long frame based on historical experiences, the Covid 2020 Recovery portfolio is more thematic and is more likely to be modified over time.

After additional testing, I will report my findings on this evaluation. 

3/26/2020

Research Note: Model Portfolio Returns During Covid Crash 1/1/2020 thru 3/20/2020

The recent market decline has been dramatic. The last month has been a real-time stress test of the design of the Focused 15 Investing model portfolios.

I'd like to review how the popular model portfolios held up during this period. The graphic quality of the tables below is not good so I will discuss the columns of the table in detail for the DJIA. A large version of the table appears toward the end of this note.

Column A shows the annualized rate of return for the DJIA for the 5-plus years from 7/18/2014 (the first week of the Focused 15 Investing publications) through 3/20/2020 (last Friday). The DJIA returned 4.7% per year, on average, over that period. A higher percentage is better.

Column B shows the variability of those DJIA returns, 16.4%. Here, a lower value is better.

Column C shows the ratio of those two numbers. A higher ratio is better. The Return-to-Variability ratio for the DJIA over this 5+-year time period has been 0.3.

Column D shows the year-to-date (YTD) return for the DJIA. The return has been -33%.

Column E shows how much of the DJIA history of returns has been wiped out by the recent decline. Last Friday's price was the same level that the DJIA last had on 4/21/2017, 152 weeks ago.

Finally, column F shows the longer-term performance of the DJIA, beginning 1/7/2000. Its annualized return for the last 20 years has been 5.1%.


As you know, the DJIA is very important to the model portfolios and is a useful reference for comparison.

The chart below adds the Diamond (sg131) model portfolio to the information above.


Column A, row 2 shows Diamond (sg131)’s annualized return of 9.3%. This compares favorably to the 4.7% annualized return for the DJIA.

Column B shows the Variability. Diamond has Variability of 16.5%, which is very close to the variability of the DJIA.

The Return-to-Variability ratio is 0.6, which compares favorably to the DJIA's ratio of 0.3.  Our goal is to get higher return for the same variability and this statistic reinforces that we are moving toward that goal, even in a down market.

Regarding the YTD loss (Column D), the Diamond model portfolio returned -32%, similar to the loss for the DJIA. The Diamond model portfolio has given up 131 weeks of returns (Column E). The level as of last Friday is where Diamond was on 9/15/2017.

Column F shows that Diamond model portfolio returned 18.7% annualized over the past 20 years - even after the recent decline. Of course, much of this history represents a historical simulation and it is best to consider this number a general guide of the return potential of the model portfolio - it is quite a bit higher than the return of the DJIA.

The table below adds some of the reference portfolios in the weekly publications.


As of last Friday, the Vanguard fund VASGX (row 10) returned 2.7%, annualized, over the 5+ years since 7/18/2014. VASGX holds 80% stocks and 20% bonds. Its year-to-date return is -22%. This is a smaller loss than the DJIA or Diamond (sg131). VASGX's level last Friday is where it was 4/28/2017, 151 weeks ago. This is about the same as what the DJIA has done and more than Diamond (sg131)'s 131 weeks. VASGX's annualized return since 2000 is 4.0%.

I included the Russell LifePoints Fund (RALAX). I worked at Russell for several years and their investment strategy (multi-manager, multi-style diversification) is used by many investment firms around the world. RALAX had a return for this year of -29%, which is not far from the loss of the DJIA and the Diamond model portfolio. Yet its annualized return since 7/18/2014 is -1.4%. It gave up all the returns it has earned for 213 weeks (since 2/17/2016). Its long-term returns (since Jan 2000) have been 4.1%.  The returns for funds listed under "Funds for Performance Comparison" reflect fund fees, which vary from fund to fund.

The table below adds other popular Focused 15 Investing model portfolios.


A few points are worth noting.
  1. The Onyx mixes displayed good performance characteristics in the decline.
  2. The Diamond-Onyx Mix (sg218) shown on row 3 had a loss of 19% this year and has returned 9.7% annualized from 7/18/2014 through last Friday. It has given up only 60 weeks of its returns during the decline. As of last Friday, it was at the same level as on 1/25/2019, 60 weeks ago. The long-term simulated return (since Jan 2000) has been 16.4%.
  3. The Onyx sleeve is shown for reference, but it is not a separate model portfolio. It works best in partnership with the D5 signal set sleeve.
  4. The Onyx mixes shown in rows 5 and 6 use the DJIA-linked ETF "UDOW," which gives three times the return of the DJIA each day. The users of these model portfolios have multi-decade investment horizons. UDOW is aggressive and has achieved much higher return over the last 5+ years, yet these model portfolios experienced losses that are similar to those of the other model portfolios, suggesting that their structures held up during the recent decline.
  5. The model portfolio in row 6, Sapphire-Onyx Mix (sg299) had a loss of 36.9% this year, which is only four percentage points worse than the DJIA but has had an annualized return of 14.6% since 7/18/2014, compared to the DJIA's 4.7%. The model portfolio in row 6 is a green version of it.
Please note that the returns for the model portfolios reflect simulations and not actual accounts. Also, all model portfolios use a common group of signal sets; they vary based on the number of ETFs use and the amount of return magnification provided by the ETFs.

3/24/2020

Weekly Note - March 24, 2020

ALERT: This is a good time to return to the target weights of the model portfolio you have selected. Attached is the weekly publication.

A Likely Beginning of a Relief Rally

I am sending the note out early this week because we may be beginning the relief rally I mentioned in my recent note.

Also, the target weights for the DJIA-linked ETFs (DIA, DDM, and UDOW), call for taking some money out of the stock market at the end of this week. When you move to the target weights this week (even before Friday if you choose), use the target weights on the attached weekly publication.

The DJIA’s move higher today is, I believe, a function of these factors in addition to the Micro MRI being at an extremely low level:
  • The likely passage of the stimulus bill
  • Short-term investors unwinding their short positions (bets that the market will go down from here).
  • Bargain hunters being attracted the valuations for the DJIA
  • Possibly, the President moving to get everyone back to work

While there is much uncertainty in the real world, this may be the beginning of the Upleg A in the relief rally I mentioned in last blog post.

Now is a good time to move to the target weights of the model portfolio you used during the recent decline. When the relief rally moves up quickly, the fear of missing out on that price appreciation will be high. Be ready for that emotion, which I believe it is one of the strongest emotions that investors feel.

But I believe this is not the time to be more aggressive than model portfolio you used during the decline. There will be a better time in several weeks or maybe months for being more aggressive than you were during the decline. Of course, you are fee to use any model portfolio on the publication.

Recent blog post for more information on these topics.

If you cannot stomach the volatility of this uncertain time, you are, of course, free to reduce the aggressiveness of your account by raising cash or switching to a less aggressive model portfolio.  Please see the recent blog post for more information on this topic. https://marketresilience.blogspot.com/p/changing-portfolio-aggressiveness.html

Reduced Allocations to DJIA-linked ETFs

You may notice that the algorithms for the D5 signal set caused the allocation to the DJIA-linked ETFs (DIA, DDM, UDOW) to decrease this week. The reason driving this shift is that the market has not been responding as the algorithms expected, and the algorithms pull some money out. Basically, they are saying something is going wrong in the markets – take some money out and come back later. We may ultimately conclude that such reduced allocations were not useful in our current situation. But this signal has added value over the last 100 years, and we should follow it.

Following the Disciplines

As you know, I frequently advocate staying with the disciplines. I have seen many professional and non-professional investors lose money and their ability to focus by deviating from their established processes. I was evaluating professional investment managers for pension funds in the 1980s. The 1987 crash was interesting in that many of the investment indicators that investment professionals look at all day about the health of the markets went haywire. The indicators were erratic and in many cases contradictory. When the crash was over, we evaluated what happened and how managers navigated through the conflicting signals.

We found that those who followed their established processes did better. Those who saw the chaos and tried to reconcile all the conflicting indicators did not do as well. They responded to one indicator at one time and another indicator later, and they ended up trading aggressively to conform to what they saw most recently – believing recent information to be most reliable. I say this to disclose my bias in these situations. I feel like we are flying blind in many ways right now. But if we avoid being distracted by trying to reconcile all the conflicting information, I believe that we will navigate this more effectively.

3/22/2020

Research Note: Alphabet of Market Patterns, Valuation - March 22, 2020

Summary of My Near-term Suggestions

The scenario I outline for the recovery can help us make up for losses. In a way that is reliable and prudent.  The immediate and pressing task is to determine the right course of action over he next week or two. 
  • If you have a long-term investment horizon, stay with the target weights of the model portfolio you have selected.
  • If you have stayed with the target weights of your model portfolio through the decline, try to stay with them. The valuation analysis I discuss below suggests we may be close to a near-term bottom.
    •   If the pain gets too much for you, reduce the aggressiveness, which I discuss below. 
  • If you sold some of your stock ETFs (DIA, DDM, UDOW, XLU, or XLP during the decline, I suggest not making any changes until we are at the near-term bottom of the market, which could occur this week or shortly thereafter. I will send out an alert when I think that is upon us.
  • Now is not the time to try to be more aggressive than you have been in the past. There will be a better time for a more aggressive portfolio, which I describe below.
  • It is most important to be aggressive later on beginning at the second bottom that appears likely at this time. I will alert subscribers and outline a reasonable course of action.
Based on what happened in the Global Financial Crisis (2008-9), I suspect that the bills will not be passed tomorrow on the first vote(s) and the market may drop meaningfully. Please be mentally prepared for that drop. That drop, however, might push the market us sufficiently close to the bottom that we should respond. I will send out an alert conveying what I see as the situation, as needed. Please refer to the section on Valuation below for market context on this.

    Jeff Hansen
    Jeffrey.Hansen@me.com

Market Update - March 22, 2020 

We are in a purposefully induced cardiac arrest in terms of the economy. While most investors are panicking, let’s keep our wits about us and look for attractive buying opportunities. We can navigate the market through this crisis and make sound investment decisions.

The first part of this note summarizes what I view as the most likely path the market will take from here. The second part has my comment about market context and additional background in the key points. I know some subscribers have adhered to the target weights and others have sold out of their stock ETFs during this decline.

PART ONE

The current MRI conditions suggest that a W-shaped market recovery is most likely. It is also the one that seems to fit the current economic situation and is the one that is most cautious. If we prepare for this pattern, we can easily accommodate other types of recovery pattern, which I discuss below, if they occur.

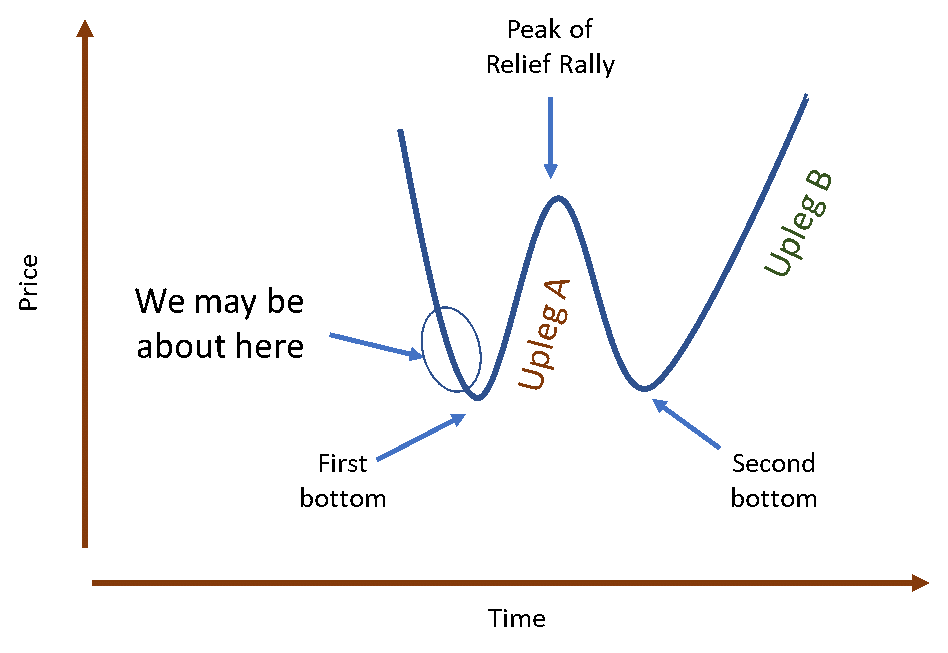
The diagram below represents the “W” pattern of stock price movements. We have had a dramatic drop in prices that is indicated by the first downleg of the W. We may soon be at the first bottom, which I discuss below in the section on valuation. From there, prices move higher when investors begin to see how some relief from the crisis and/or stocks simply become too cheap to not buy. The peak of the relief rally often coincides with a peak in the Micro MRI and the second decline is often precipitated by negative news that the recovery will be slower than hoped. Based on the current MRI conditions, I believe the second bottom will be easier to identify than the first. Also, I cannot determine right now if the second bottom will be higher or lower than the first.


As we get to the first bottom, it will be beneficial for you to have your portfolio match the target weights of the model portfolio you have been following thus far. I know some subscribers have sold stocks because the pain of the losses was great. If you can stomach the uncertainty of the coronavirus economic shutdown, I suggest that when I alert you that the first bottom (i.e., the near-term bottom) is upon us, you get back to the target weights of the model portfolio you have been using. If you are having trouble sleeping at night because of the markets and want to reduce the aggressiveness of your portfolio, you have two options.

You can easily change the aggressiveness of your portfolio by increasing the amount of cash you are holding. You do this on the Shares-to-Trade worksheet by increase the value in Box #2 (cash level). This is the percentage of your account that is not invested in the ETFs listed on the sheet.

Alternatively, you can select a less aggressive model portfolio from the weekly publication.

Please see this page for some additional detail on how to change the aggressiveness of your portfolio: LINK

Historically, the MRI framework has been good at identifying the end of relief rallies, such the end of Upleg A. I plan to give special alert outside of the regular weekly publication that the Micro MRI is beginning to indicate a peak.

At the second bottom, it will be very important to resume following the target weights the model portfolio you are comfortable with longer term, or one that is more aggressive. For example, if you followed Diamond (sg131) during the decline, follow Diamond (sg131) after the second bottom. Or, if you have followed Diamond-Onyx Mix 35-65 (sg218) during the recent decline, follow it after the second bottom.

If you want to be more aggressive after the Second Bottom, consider using Diamond-Onyx 50-50 Mix (sg118). The second bottom might be the most important point over the coming months – fully participating in the rebound of the Second Bottom is very important.

Regarding timeframe, based on the normal cycles of the MRI, I would expect the relief rally to end in May (roughly) and the second bottom to occur in May, June, or July. Of course, these are general estimates and we will get more visibility on the situation as we move forward.

Be ready for special alerts, which I describe in a section below. I anticipate being able to alert subscribers early in the week and you can decide how to respond. I believe we get many benefits from sticking to a weekly trading discipline over the long term. But the current unprecedented situation justifies some flexibility on this.

Anticipated Upcoming Alerts
  • Likely First Bottom - At the recent pace of declines, an alert may occur over the next few days. Certainly within a few weeks we will hit the first bottom. Adhere to the target weights of your selected portfolio. The value in Box #2 should be the same or slightly more than what it was on the recent decline. In other words, the aggressiveness of your investment in the stock market should not exceed the aggressiveness of you used during the decline. 
  • End of First Upleg of the W - If the MRI begin to indicate an inflection point, I will send out an informational alert. I will say in the alert to consider raising the cash level by, say, 20 percentage points. If you typically hold 3%, hold 23% or more. Of course, you may elect to hold more cash and reduce aggressiveness even more.
  • Second Bottom – The MRI have successfully identified the situations like the Second Bottom – the Exceptional Macro is specifically designed to indicate this type of inflection point. At that time, make sure you are using the model portfolio you’d like to use over the long term. For those who want to be more aggressive, use the model portfolio to the right of the one you have been using thus far. I will say in the alert to consider reducing cash to your typical minimum, which should be 3-5%.
Summary diagram:

The yellow box says: "Target weights of current model portfolio, or less aggressive." If at all tolerable, stay with the target weights of the model portfolio
The green box says: "Target weights of current model portfolio, or more aggressive"


Should we find that the W-shaped recovery is not relevant, I will describe what is taking place.

The historical simulation for the main signal set driving the model portfolios (D5) shows it has adapted to the various recovery patterns described in a section below. The graph below shows the simulated D5 performance in the green line. The DJIA as the brown line.  The graph is on a log scale. You will note that our approach using a weekly trading discipline did not avoid the crash of 1987 (shown in the green box). But the recovery was reasonable. Over all the approach produced strong simulated returns and avoids many of the major losses over this time period.


Slightly Revised Model Portfolio Lineup on Diamond

The most widely used model portfolios have been Diamond (sg131) and Diamond-Onyx Mix (sg218). I have added model portfolios having the same signal sets and ETFs but are more or less aggressive. Whereas in the past, I discouraged switching model portfolios, the new lineup makes that less of an issue. They are similar enough - varying only by aggressiveness - that moving to an adjacent model portfolio is acceptable.

PART TWO

Market Context


The current situation may be analogous to an intentionally inducted cardiac arrest – shutting businesses to allow people to stay home in order to stop the spread of the virus and to prevent overwhelming the medical system. Leaders around the world have stopped the economy and are at the same time are adding stimulants (checks in the mail, extending unemployment insurance, etc.) to resuscitate the economy. There is often a lag between the time the stimulants are administered and when they take effect, so it is important to apply the stimulants as soon as possible. If we think of the stock markets as the heart rate monitor, we can see that the heart is indeed starting to flatline. We wait anxiously until we see that the economic heart restarts.

Of course, these market dynamics are not entirely explained by cycles of resilience, except to say that the spike in coronavirus cases in the US came when the Micro MRI was in the vulnerable part of its cycle.

I believe a case could be made that if we shut down the economy, we should also shut down the stock markets – the decline in the stock market is making many feel like our economic health is getting worse, when the decline is actually part of the cure that has been prescribed to address this non-economic issue (the virus). We rightfully have understood that the stock market generally reflects the value of the future economic returns of publicly traded companies. When the future appears bleak, stock prices decline. But that may not fit this intentional stoppage and investors hate uncertainty.

I believe the global economy will ultimately be resuscitated, but also anticipate that this episode will bring other underlying problems to the surface, such as too much consumer and business debt. Stock market declines and economic stress typically cause unemployment and push companies out of business, which push stock market prices down further. Some of these suspected non-virus problems could be true and might have produced a recession and market declines on their own over a more extended timeframe. But the virus and this intentionally induced economic arrest bring some of them to the forefront and demand solutions in order to resuscitate the economy.

While the current situation is alarming, I want to stress that what we are seeing is an intentionally induced economic arrest with the stimulus happening almost simultaneously. In past market economic and market declines, leaders have been slow to recognize that economic problems as they are occurring.

In addition to these problems, leaders during the Great Depression of the 1930s came forth with the wrong remedies. They selected a remedy that was a tough love approach. In the time I have today, Wikipedia is my source for this quote, (https://en.wikipedia.org/wiki/Great_Depression):

At the beginning of the Great Depression, most economists believed in Say's law and the equilibrating powers of the market, and failed to explain the severity of the Depression. Outright leave-it-alone liquidationism was a position mainly held by the Austrian School.[33] The liquidationist position was that a depression is good medicine. The idea was the benefit of a depression was to liquidate failed investments and businesses that have been made obsolete by technological development to release factors of production (capital and labor) from unproductive uses so that these could be redeployed in other sectors of the technologically dynamic economy. They argued that even if self-adjustment of the economy took mass bankruptcies, then so be it.[33]
Because of the disastrous effects of the tough love approach during the 1930s, today’s remedies that seek to enhance business and personal income continuity. Governments give money to individuals and are backstops for businesses large and small. Thus, indulgent love may sow the seeds of future problems – such as people developing the expectation that if they fail the government will rescue them - but at least the economy can rebound before deep damage is done to the economy as was the case in the 1930s.

We fear reliving the Great Depression and the 80% decline in the stock market, and it is probably healthy to keep that experience in mind. But I believe this situation is different. We know that metrics commonly used to indicate recessions and depressions will soon spike. We can expect the unemployment rate to go much higher. Bankruptcies will also increase.

But the key driver of this downturn can end when the virus is contained and the resuscitation steps are already being applied. In recessions developing from within the economy, stimulus packages are typically delayed. Considering the delay and natural lag time required for the stimulus to have an impact, the economy suffers more.

The speed of resuscitation is crucial; the longer it takes, the more the economy deteriorates. Each week, thousands of people will be laid off and companies will slip into bankruptcy. While the coming recession could be deeper than usual because of the synchronized massive global shut down, it could be shorter than usual because of the extraordinary stimulus measures taking place around the world.

The DJIA May Be in the Bargain Basement as of Friday March 20, 2020

We can get an idea of how far prices might drop by looking at Friday’s (3/20/2020) valuation of the companies in the DJIA compared to the lowest levels of prior market declines. The most common valuation measure is the Price-to-Earnings ratio. This relates the current price of the companies to their earnings. However, in the current situation, we may not have a lot of confidence in the any assessment of earnings. The recent past may have little relationship to future earnings given the current economic arrest.

Instead, I’ll focus on the Price-to-Book ratio because it is more conservative. This ratio relates stock price to the hard assets of the company. For example, Apple Computer has buildings, machinery, computers, plants, land, etc. The Price-to-Book ratio looks at the current price relative to those hard assets. This is a conservative measure because it does not consider earnings, which can vary over time. In addition, this ratio does not include intangible assets, such as the brand name, that have real value. Because of the Apple brand and the talent of its people, it is probably worth more than a simple sum of its plants and equipment. Thus, the Apple, Nike, and IBM brands have value that is not considered in the Price-to-Book ratio. To get the average value for the DJIA, the individual company ratios are used to create one ratio for the index.

The two charts below show similar information. The first one provides more context for the points, but I include both because the second because it is easier to read and summarizes the main points. The first chart covers the 1995 to the present, and the DJIA is shown by the dark blue line (not on a log scale) and the Price-to-Book ratio in the thin light blue line. The ratio bounces around, but I’d like to focus on the values at the bottom of major declines. Lower values mean that the price for the stocks is low compared to their hard assets. These values have been similar over the last 25 years and range from a high of 3.5 to a low of 2.3. The current value (as of 3/21/2020) is 2.9. This is down from a ratio of 4.4 just a month ago.


By this measure, prices are closer to the bottom than to the top. So, stock prices are getting cheap. This level may be cheap enough that investors will start coming in simply because they are getting good hard assets at a low price. They may not care what earnings are this year or next year. They simply know that these quality companies are likely going to grow and make good use of these hard assets.

Thus, a week ago (what seems like an eternity), I thought prices could go lower. But now, just because these great companies are moving into the bargain basement, I believe that investors will soon come in and start buying.

The chart below is a simpler version that covers 2000 through the present. It plots the DJIA on a log scale and shows the Price-to-Book ratio for the major market price bottoms. Beginning with the major decline in 2009, the Price-to-Book ratios have been 2.3, 2.3, 2.8, and 3.5. After the market has achieve these levels there has been a strong rebound in prices. The average Price-to-Book ratio over the last four March values (2020, 2019, 2018, and 2017) has been 4.0. Thus, the recent price decline has produced valuation (Price-to-Book ratio) levels similar to recent market bottoms.


It could be that this time is different, but I believe we have declined to a level that might represent the bargain basement for these 30 high quality companies. It may not be wise to reduce aggressiveness dramatically at this time. A slight reduction can be okay if it helps you sleep at night. If you have an investment horizon longer than, say, 7 years, try to stay with the target weights (don’t increase the cash level).

See this link for the companies in the DJIA.  

Don’t Just Do Something, Stand There

In my training videos, I mention a saying I heard at a conference: Don’t Just Do Something, Stand There. This means that in times of crisis or uncertainty, it is often better to NOT make a change. In general, things are not as bad as they seem. People overreact to their fears sending prices far lower than their true value. The valuation comment above is one reason why this saying is relevant. The MRI status is another reason. The Micro MRI and another important MRI (that I don’t often mention), are both at historic lows. Both suggest that there is more likelihood of prices moving higher than lower. If you can stand the short-term pain of additional big price swings due the crisis atmosphere, the current DJIA level may be a fabulous bargain.

As we have found out, trading one’s account requires that you look at your account balance each week, and the decline in that balance has been painful. With the idea that prices will bounce back, it sometimes helps to think of losses as paper losses – yes, the market has placed a low value on the DJIA at the moment, but the market is not making a sound judgment because of the panic. Investors overreact to both good news and bad news. What we are seeing now could easily be an overreaction that will be ultimately be corrected.

The Alphabet of Market Declines and Recoveries

Unless our economy fails to be resuscitated, there will be a recovery. The question becomes, “What will the recovery look like?” You may hear various descriptions of market recoveries using different letters of the alphabet. The description relates to the letters V, L U and W. At the moment, I believe the W pattern is most likely. This section describes this range of market declines and recoveries.
V-shaped Pattern

A few weeks ago (which seems like an eternity) I urged patience because many sharp declines are "V" shaped. When many investors see a negative event, they panic and sell. When the event passes, the markets recover quickly. Prices decline and make a complete recovery and then continue to move higher. The chart below shows 1974, during the oil shocks of that decade.


L-shaped Pattern

The L-shaped patterns pattern is unusual over the last 100 years. The main example is the 1987 crash and subsequent recovery. The DJIA declined abruptly and sharply over the course of a few weeks. I describe in my material on Focused 15 Investing that a decline of this type cannot be avoided using our weekly trading strategy, and that has proven to be the case in the current market decline. After the decline in 1987, price recovery was slow compared to the V-shaped recovery. It took the DJIA roughly two years to surpass the peak of the market before the crash.


U-shaped Pattern

A U-shaped recovery does not have a sharp rebound but ultimately does rebound. An example of this is the 1990 decline.


W-shaped Pattern

It may be most prudent to expect a W-shaped recovery. The decline we have already had is the first down-leg of the W. We should soon approach the bottom of the first decline. Then a rebound indicated by the first upleg of the W. I think it is most prudent to assume it is not going to be a completely recover to the price level of, say, a month ago. The peak in the middle of the W is the end of the relief rally. The second downleg typically comes quickly and the bottom can be higher or lower than the first bottom. The following graph shows the Russian Debt Crisis and Long-term Capital Management collapse in 1998.

If we prepare for the W-shaped recovery, we can easily recognize a shift to a V-shaped one and move forward from there. The shift from W to V can be smooth.

We should soon find out if the recovery is U-shaped. In this case, declines stop but prices do not move up for a while. After some repair of the economy and greater visibility into the future, prices move higher again.

Please contact me with questions or comments.