
The note below covers:
2. New Page – Repeated from Last Week’s Note
3. Performance
1. Market Comment
As you may recall, the timing of this move higher is not a surprise; it is consistent with the projected movements of the Micro MRI. Since the beginning of 2022, the Micro MRI has generally followed its projected path. If the DJIA continues to follow the projected path, the current counter-trend rally will end in early November. Stock prices are then likely to be less resilient through the end of this year.
In addition to the projections calling for further price declines in a few weeks, the computer models and algorithms based on the MRI also are very cautious about the mid-term outlook for stocks. The following points describe the MRI conditions for the DJIA as of 10/21/2022. Please see this link for a discussion of our terminology: https://focused15investing.com/language
Stepping outside the MRI framework, the valuations of the companies in the DJIA are still high compared to their valuations between January 2000 and last Friday. Figure 1 below shows the current ratios and historical reference points. Please see this page for a brief description of these ratios.
Figure 1
In addition to the projections calling for further price declines in a few weeks, the computer models and algorithms based on the MRI also are very cautious about the mid-term outlook for stocks. The following points describe the MRI conditions for the DJIA as of 10/21/2022. Please see this link for a discussion of our terminology: https://focused15investing.com/language
- The Macro MRI has been in the downleg of its cycle since mid-December 2021, when it peaked at about the 80th percentile. The downleg continues and shows no sign of ending. A shift to the upleg of the Macro MRI cycle will be a strong indicator of the end of the current bear market.
- The Macro MRI has declined to a low level. It is at the 32nd percentile of levels since 1918. The decline of the Macro from its recent peak at the 80th percentile to the current 32nd percentile has been quite steep. While I do expect it to decline further, we are coming closer to the inevitable end of the decline.
- The Micro MRI is at the 26th percentile and in the upleg of its cycle. As mentioned above, the most likely path indicated by the projections is for it to move higher through early November and then begin another downleg that will be in place since through the end of the year.
Valuations for the DJIA are Still High
Figure 1

The Price/Book (P/B) and Price/Sales (P/S) ratios are most important for this discussion. They are still high compared to the range of values since January 2000. The percentile rankings of the current values are 85th and 87th, respectively. In a time of slower economic growth and higher interest rates, I expect these valuation ratios to drop to levels close to or below their average valuation ratios indicated above (their 50th percentile rankings). DJIA prices will need to fall further to achieve those levels. In my elaboration of the industry adage “A Bull Market Climbs a Wall of Worry,” point #3 is relevant here – the current high valuation ratios suggest that stock prices will fall more than they already have.
This relatively low P/E ratio is noteworthy. When P/B and P/S ratios are high and the P/E ratio is relatively low, we can infer that the market, in its collective wisdom, is indicating that the current level of corporate earnings is abnormally high and is likely to decline.
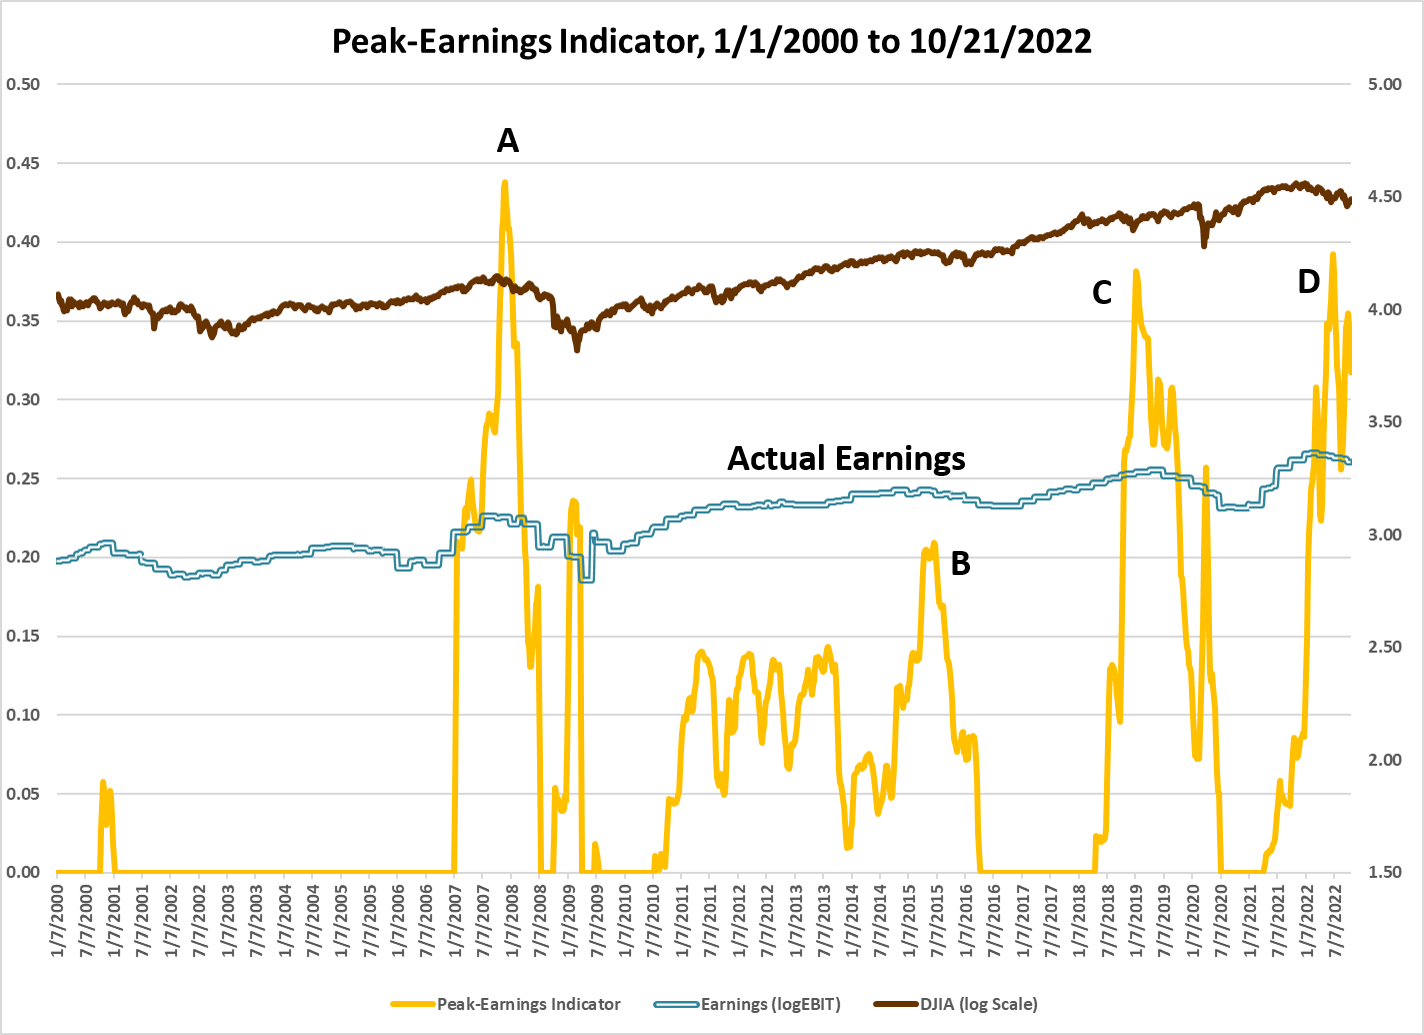
Figure 2 below shows the price of the DJIA (log scale, brown line), with the Peak-Earnings Indicator (PEI) in yellow. Last Friday is at the far right. The current decline, which began in December of 2021, is indicated by “D”. As you can see the PEI is still high compared to the PEI before the Global Financial Crisis (A) and the Covid Crash of 2020 (C).
Figure 2

The double blue line in Figure 2 above indicates actual earnings of the DJIA companies. At the far right of the line, we can see that earnings level has declined from its peaks at the end of 2021. But we can also see that the decline in earnings has been less than the declines that occurred after the high PEI readings at points A and C, despite the indicator being at a similarly high level.
Figure 2
The double blue line in Figure 2 above indicates actual earnings of the DJIA companies. At the far right of the line, we can see that earnings level has declined from its peaks at the end of 2021. But we can also see that the decline in earnings has been less than the declines that occurred after the high PEI readings at points A and C, despite the indicator being at a similarly high level.
The recent decline in earnings thus far is even less than decline taking place after B, even though the PEI is currently quite a bit higher now (D) compared to B. If historical patterns hold true, corporate earnings are likely to continue to decline further from here. If you would like to read my discussion of the PEI, I describe it here.
Thus, with the Macro MRI indicating a lack of resilience, high P/B and P/S valuation ratios, and the PEI still signaling abnormally high earnings and lower future earnings, the most likely path for stocks as tracked by the DJIA is for further stock price declines than we have seen thus far in 2022. Other stock indexes have similar MRI conditions, with the exception of the tech-heavy NASDAQ, which is a little further along the downleg of its Macro cycle. It is perhaps closer to the inevitable inflection point indicating the end of its bear market.
As the country moves into an economic recession, the Fed will be more inclined to slow interest rate increases and perhaps even induce lower rates. These moves may make our bond ETFs more resilient. I suspect that decreasing our Box #2 Cash levels and increasing the bond allocations will be one of next major moves. However, as of today, the timing is not right for this change.
On page 2 of the weekly report, I show the target weights for all model portfolios. There is no new information on page 2. This page simply pulls together information stated on other pages, which still exist. My goal is to simplify your task of locating the target weights you need to use.
If you have selected the portfolio indicated as “Main” as your long-term portfolio, the orange box indicates the portfolio that you should be using at this time. The portfolio in the orange box is one step less aggressive than the Main portfolio, as specified in the note, “Box #3 Portfolio Shift Relative to Your Long-term Portfolio: -1.”
If you are using for your long-term portfolio one other than the Main portfolio, use the next less aggressive portfolio to implement the Box #3 Portfolio Shift: -1.
Below are estimates of the returns that one would get from December 31, 2021 through last Friday by following the instructions for the “main” portfolios for each of the publications. Please see endnote for a brief comment on the main portfolios. Contact me with questions.
The year-to-date returns as of 10/21/2022 are:
Thus, with the Macro MRI indicating a lack of resilience, high P/B and P/S valuation ratios, and the PEI still signaling abnormally high earnings and lower future earnings, the most likely path for stocks as tracked by the DJIA is for further stock price declines than we have seen thus far in 2022. Other stock indexes have similar MRI conditions, with the exception of the tech-heavy NASDAQ, which is a little further along the downleg of its Macro cycle. It is perhaps closer to the inevitable inflection point indicating the end of its bear market.
Bonds Likely to Become More Attractive
As the country moves into an economic recession, the Fed will be more inclined to slow interest rate increases and perhaps even induce lower rates. These moves may make our bond ETFs more resilient. I suspect that decreasing our Box #2 Cash levels and increasing the bond allocations will be one of next major moves. However, as of today, the timing is not right for this change.
2. New Page – Repeated from Last Week’s Note
If you have selected the portfolio indicated as “Main” as your long-term portfolio, the orange box indicates the portfolio that you should be using at this time. The portfolio in the orange box is one step less aggressive than the Main portfolio, as specified in the note, “Box #3 Portfolio Shift Relative to Your Long-term Portfolio: -1.”
If you are using for your long-term portfolio one other than the Main portfolio, use the next less aggressive portfolio to implement the Box #3 Portfolio Shift: -1.
3. Performance (not audited)
The year-to-date returns as of 10/21/2022 are:
Diamond: -8.6%
Sapphire: -10.7%
These returns compare favorably to the following alternatives:
DJIA: -13.4%
S&P500: -20.3%
NASDAQ: -30.1%
IEF: -18.0% ETF for the US 7-10-year Treasury bond index, with no leverage
VBINX: -19.5% Vanguard Fund with 60% of assets in stocks and 40% in bonds
VASGX: -21.5% Vanguard Fund with 80% of assets in stocks and 20% in bonds
Endnote: Main Portfolios
The main portfolio in the Diamond publication is sg235, and the main portfolio in the Sapphire publication is sg325. If you use either of these as your long-term portfolio and have followed the instructions since the first of the year by switching to the target weights of a less aggressive portfolio (by following the specification for Box #3, i.e., “-1”) and holding Box #2 Cash as instructed, your account’s performance should be close to the figures above.
Some deviation between your account and the numbers above can be expected. The performance figures above assume trading is done at the close of trading (4 pm, Eastern) on Fridays. Most people trade earlier in the day. In addition, we sometimes trade before Friday.
Some deviation between your account and the numbers above can be expected. The performance figures above assume trading is done at the close of trading (4 pm, Eastern) on Fridays. Most people trade earlier in the day. In addition, we sometimes trade before Friday.
If you use as your long-term portfolio one that is more aggressive or less aggressive than the “Main” portfolio, your actual performance will be different.
The figures above are based on the actual ETFs in the model portfolio. The figures in the weekly publication are based on the index that the ETFs track.