The note below covers:
1. Market Comment
2. Current Valuation Ratios
3. Conclusion
Note 1: Corporate Earnings Have Not Yet Come Down
1. Market Comment
The short-term cycle of resilience (measured by the Micro MRI) for the DJIA was at the 82nd percentile of levels since 1918 as of last Friday, which is a high level. The computer models and historical precedents continue to indicate that the recent move higher in the stock market is likely to be temporary and stock prices (as tracked by the DJIA) will be more vulnerable to declines when the Micro MRI moves to the downleg of its cycle. Please see this page for the language used to describe the MRI cycles:
https://focused15investing.com/language
The Macro MRI, which indicates the longer-term trend of the stock market, is becoming less negative. In addition, the Exceptional Macro is very close to appearing for several stock market and bond market indexes. If these do indeed change, they would indicate a bullish view of the stock market (stock prices continuing higher) that could last several quarters or longer. As this shift takes place, we must recognize that the low point of this market decline might have already taken place at the end of September (when the Micro MRI began its upleg). At that time, there was little indication that these positive shifts might take place soon.
Nonetheless, the computer models and algorithms indicate that stock prices (as measured by the DJIA) are likely to be more vulnerable to declines over the coming weeks when the Micro MRI inevitably moves to the downleg of its cycle. Thus, our portfolios are still defensive. Qualitatively, I believe there will be a better time in the future for our portfolios to be aggressive. This view is supported by the high valuation ratios of stocks.
2. Valuations for the DJIA are Still High
Stepping outside the MRI framework, the valuations of the companies in the DJIA are still high compared to their valuations between January 2000 and last Friday (11/25/2022). Figure 1 below shows the current ratios and historical reference points. Please see
this page for a brief description of these ratios.Figure 1
The Price/Book (P/B) and Price/Sales (P/S) ratios are most important for this discussion. They are still high compared to the range of values since January 2000. As one can see in Figure 1, the percentile rankings of the current values are both at the 93rd level in this time period. These are high figures meaning stocks are not cheap based on recent actual book values, sales, and earnings. These figures say stocks are expensive.
In order for these high levels to be justified, corporate earnings growth will need to be strong going forward. In a time of slower economic growth induced by the Federal Reserve with higher interest rates, an outlook for especially strong economic growth does not seem to be the most likely scenario.
Historically, these valuation ratios are low at market bottoms - closer to their average valuation ratios indicated above (their 50th percentile rankings). DJIA prices will need to fall further to achieve those levels. In my elaboration of the industry adage “
A Bull Market Climbs a Wall of Worry,” point #3 is relevant here – the current high valuation ratios suggest that stock prices will fall more than they already have. While not shown, the P/B and P/S ratios for the S&P 500 stock index are also high rating at the 85th and 92nd percentiles, respectively.
3. Conclusion
The markets have been transitioning over the last several weeks and I expect them to continue to do so for the next few weeks. The markets are undergoing a shift from investor concerns being focused on inflation and high interest rates to a concern about recession and high valuations. However, instead of the market moving straight from a)
inflation fear, to b) recession/valuation fear, the market seems to be going through an intermediate step: a) inflation
fear, to b) everything will be OK (soft landing), to c) recession/valuation fears. A soft landing means that the Fed slows economic growth to curb inflation but does not push the economy into recession. Historically, soft landings have been difficult to achieve.
Currently high valuation ratios support the potential dominance of c) recession/valuation fears. Yet, the MRI are starting to signal an
“OK-soft landing” for now. We had a similar situation in the early
2000s, and there was a further decline after a “OK-soft-landing”
period of a few months, which the MRI identified. This view is supported by the Peak-Earnings Indicator analysis described in note 1 below. As the transition becomes clearer, we will move either way – becoming more or less aggressive.
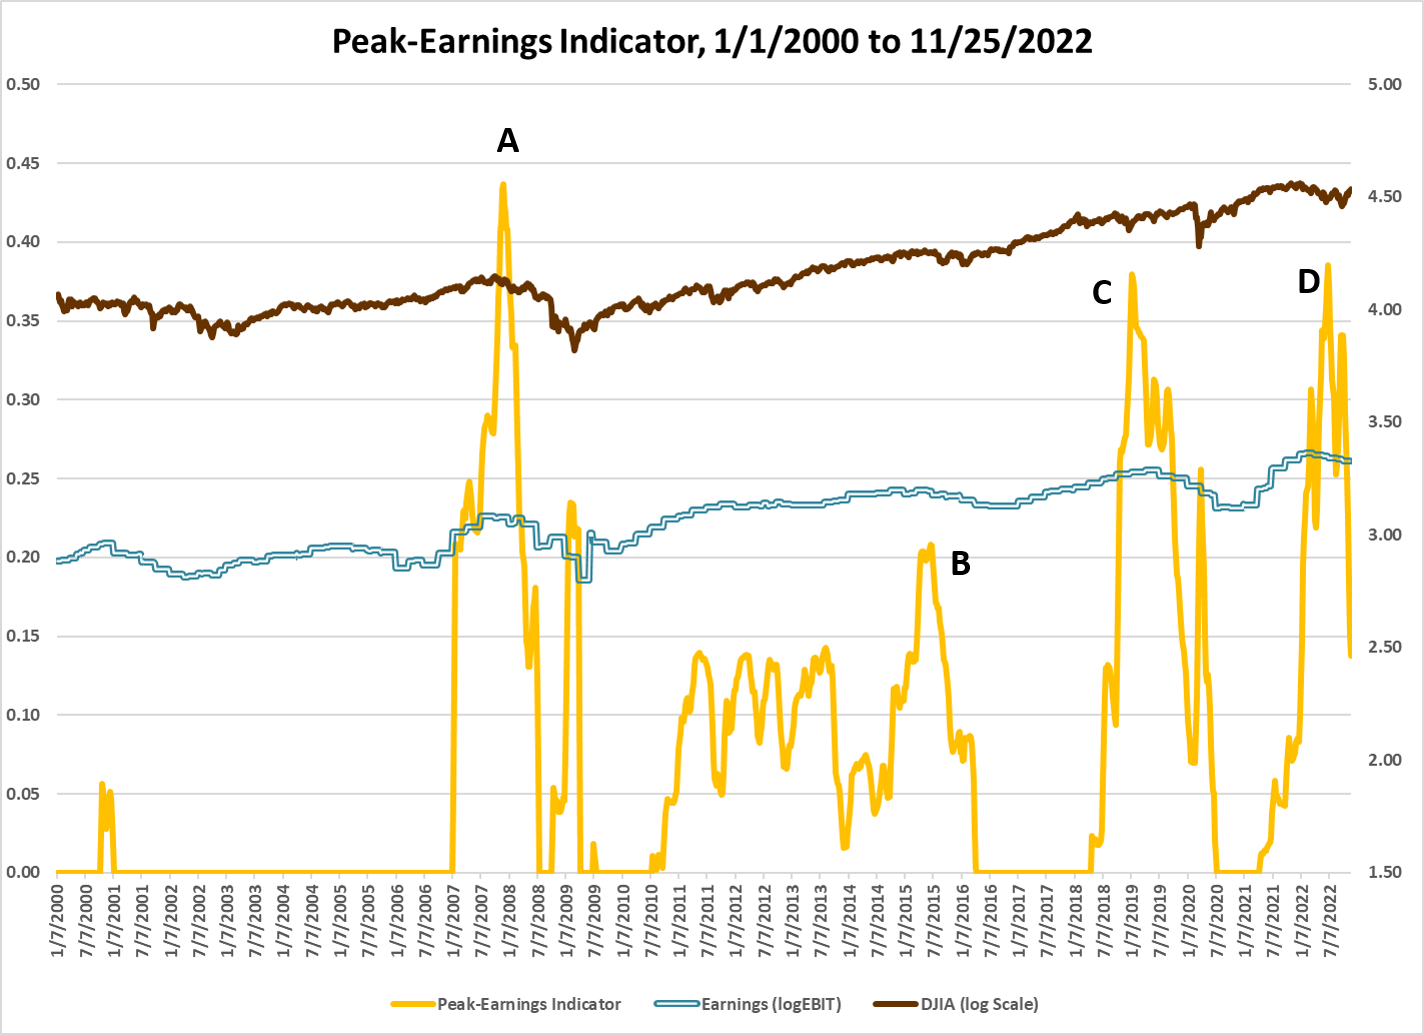
Note 1: Corporate Earnings Have Not Yet Come Down
Figure 2 below shows the price of the DJIA (log scale, brown line), with the Peak-Earnings Indicator (PEI) in yellow. Last Friday is at the far right. The current decline of the DJIA, which began in December of 2021, is indicated by “D”. The PEI signaled that corporate earnings are abnormally high throughout much of 2022, but earnings for the companies in the DJIA (shown by the double blue line) have not yet declined as far as they have after the prior declines A, B, and C.
Figure 2

If historical patterns hold true, corporate earnings are likely to continue to decline further from here. You can also see that the declines in earnings take place several months after the PEI has peaked. If you would like to read my discussion of the PEI, I
describe it here.
Based on the PEI and this analysis, the effects of a recession have not yet been seen in corporate earnings. Corporate earnings are likely buoyed by the ample Covid stimulus still in the system. That stimulus is helping to drive inflation, and the Fed is trying to dampen the effects of that stimulus. Thus, the economic battle between inflation and recession continues and we appear to be lull between the two extremes.