3/10/2022

Weekly Note - March 9, 2022

This note covers:
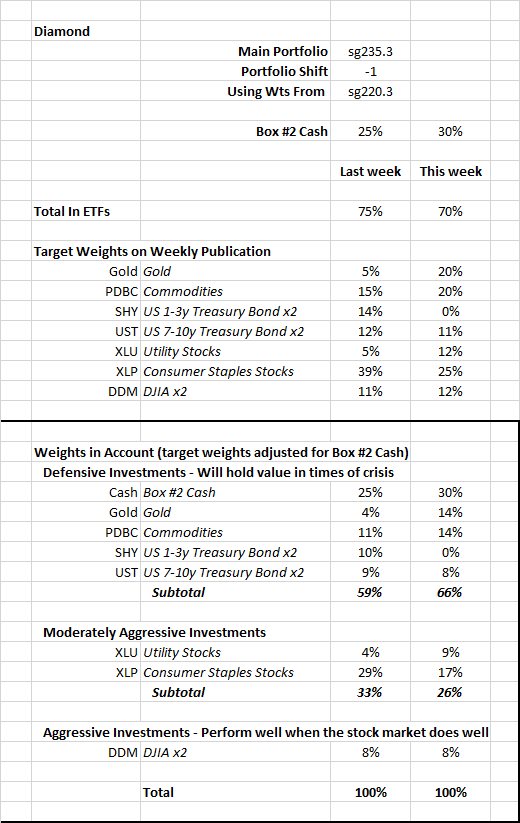
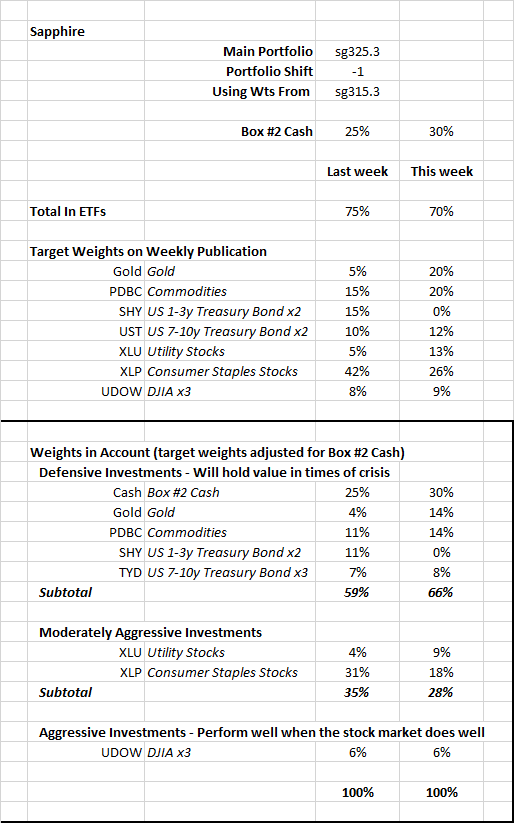
  1. The performance of accounts that follow the weekly instructions for the main Diamond and Sapphire portfolios since the beginning of the year
  2. Three themes affecting the markets
  3. Outlook and Possible Changes in Theme ETFs

1. Performance – Year-to-Date

The US stock market has declined from December 31, 2021 through last Friday, March 4, 2022.  I have calculated the returns that one would get by following instructions since the beginning of the year. Specifically, if you followed the “main” portfolio in Diamond (sg235) and switched to alternative target weights and held Box #2 Cash as instructed.  

Similarly, if you followed the “main” portfolio in Sapphire (sg325) and switched to alternative weights, etc. as instructed.  These figures are based on the actual ETFs in the model portfolios (in contrast, the figures in the weekly publication are based on the indexes that the ETFs track). 

The returns are:

  Diamond:          -2.6%

  Sapphire:           -3.2%

If you use as your long-term portfolio one that is more or less aggressive than the "main" listed in each publication, your actual performance will be different.  These returns compare favorably with these alternatives:

  DJIA:                    -7.2%

  S&P500:               -8.9%

  NASDAQ:           -14.8%

  VBINX:                -7.1%    VBINX (Vanguard Fund that has 60% of its assets in stocks, 40% in bonds)

  VASGX:               -8.5%    VASGX (Vanguard Fund that has 80% of its assets in stocks, 20% in bonds)

The Vanguard funds appear on the Return-to-Variability charts on the first two pages of the weekly pdf.  You can see that our portfolios have better return and variability characteristics than the Vanguard funds over the time periods shown. 

2. Current Market Themes

Three major themes appear to be affecting the market.

   Theme One – Lower Resilience 

From fall 2021 through to the present, the MRI have indicated decreasing market resilience (greater vulnerability).  In the fall of 2021, the computer models and algorithms reduced aggressiveness of our portfolios, which meant that we moved out of the stock market.  Many of these were false alarms and the stock market moved higher.

As you may remember, the investment process tends to underperform in the late stage of an ascending market and there are numerous false alarms just before a major market decline.  This is an apt description of the last months of 2021. The Macro MRI finally made a clear move to the downleg of its cycle in mid-December and prices subsequently peaked at the end of December.  However, the false alarms suggested that we were in the late stage of the strong ascending market that would be followed by a meaningful decline.

The research I’ve done on developing longer-term forecasts of market resilience has pointed to lower resilience in the coming weeks as well. The longer-term forecast done in December for the first four months of 2022, called for the Micro MRI for the DJIA to make a double dip, which is for the Micro to form one low point (which occurred at the end of January), move higher, and then return to form another low point before moving toward its normal high level.  This happens from time to time and it is happening now, as forecasted in December. The Micro MRI is now in the downleg of a cycle. Unfortunately, this downleg is occurring when there is high inflation, a war in Europe, supplies of commodities are being reduced because of the war, the Fed is poised in raise interest rates, and the Macro MRI is clearly in the downleg of its cycle.   

Since mid-December, the market has moved generally in accordance with the forecasted resilience levels.  If that continues to be true, we can expect additional stock price vulnerability and possibly price declines over the next few weeks.   

In addition, some valuation measures (price-to-sales, price-to-book ratios) suggested that late 2021 might be a period of peak company earnings; the market may have been anticipating a decline in earnings. Thus, both the MRI and the valuation measures suggested future economic weakness. 

The forces in this theme are not part of the computer models or algorithms but they do affect my decisions about Plant/Wait/Harvest designations, the inclusion of theme-related ETFs (such as the current commodity and gold ETFs we currently hold), and Box #2 cash levels.      

    Theme Two – High Inflation

The prevailing narrative during late 2021 was that inflation would be high going forward and the Fed would be forced to increase interest rates. Inflation was moving higher because of Covid recovery spending and very low interest rates.  Commodity prices were indeed moving higher.  The major commodity index (S&P Goldman Sachs Commodity Index) peaked in price in October of 2021 and was somewhat lower at the end of the year, which was consistent with slower economic growth discussed in theme one. 

There was much discussion of when and by how much the Fed would increase rates.  Increasing interest rates would tend to make investors more concerned about the high stock valuation measures that had developed during the Covid stimulus spending and abnormally low rates. The NASDAQ index, which is biased toward growth stocks with high valuations, peaked at the end of November and has had the biggest year-to-date decline mentioned above.   

While stocks can well during periods of high inflation and interest rates over the long term, over the short term, prices often drop in order to achieve valuation levels better suited to higher interest rates.     

   Theme Three – Economic Upheaval Related to Russian Invasion

This theme is new.  The Russian invasion of Ukraine has resulted in higher oil and grain prices.  The commodity ETF “PDBC” has increased by a startling 10.7% in the two weeks since its inclusion (February 18) through today.  That figure includes today’s (March 9, 2022) sharp decline.  While the price of oil is volatile and we can expect sharp moves (both positive and negative), the 10.7% figure is a very sharp move up in only two weeks.  

From Barrons: “Russia is the third-largest producer of petroleum after the U.S. and Saudi Arabia, exporting almost 5 million barrels a day of crude oil in 2020, according to the U.S. Energy Information Administration. Almost half of those exports went to European countries, while 42% went to Asia and Oceania.

    (https://www.barrons.com/articles/russia-oil-imports-ban-crude-prices-51646667317)

In addition, Russia and Ukraine supply 30% of the world’s major grains.

From Time magazine: “Russia and Ukraine together supply nearly a third of the world's wheat and barley exports, which have soared in price since the invasion. The products they send are made into bread, noodles and animal feed around the world.

    (https://time.com/6156160/ukraine-bans-wheat-exports/#:~:text=Russia%20and%20Ukraine%20together%20supply,places%20like%20Egypt%20and%20Lebanon.)

All else equal, higher commodity prices can reduce demand.  This is especially true when energy prices move higher.  People drive less, turn down their thermostats, and companies find alternatives to oil.  In addition, higher commodity prices in general increase inflation readings and therefore encourage the Fed to increase rates.  But, considering that we have open battles in Europe, the Fed is, I believe, less likely to raise rates aggressively out of concerns for helping to tip the country into recession during a time of war. 

One scenario is that the Fed raises rates only slightly and allows economic growth and inflation to be higher than they otherwise would be.  Others include increasing rates and helping to tip the economy into recession. 

3. Outlook and Possible Changes

My current concern in this quickly evolving situation is that theme one – the inherently low resilience of the coming weeks - is not widely recognized.  Low resilience means that when there is bad news the market goes down and stays down; it doesn’t recover quickly or completely.  We may have tipped into a mild recession anyway without theme three (Ukraine).  The price movements of the major stock indexes so far this year generally support the validity of this concern.  In addition, themes two and three seem able to provide several opportunities for bad news to occur. In many past crises, the main event (in this case war in Ukraine) produces follow-on events over the subsequent weeks and months that are themselves bad news for stocks.   

I am therefore increasing the Box #2 Cash to 35%. As mentioned last week, we may see a counter-trend rally over the next week or so, but I believe that it will be fleeting if it does occur. 

Also, the level of Box #2 Cash has remained high since the beginning of the year.  The Plant designation lasted just one week (the beginning of February), but an expected countertrend rally failed to materialize. I anticipate reducing this cash level during the next Plant season.    

I can envision scenarios that would result in us selling the commodity and gold ETFs.  Should we need sell out of them outside the regular Friday trading schedule (most likely on a Tuesday), then I will alert you by email.  

In addition, I am considering:

  • A different ETF for the commodity exposure – one that has less weight in energy and more in agricultural commodities
  • Including the clean energy ETF that we used in the Emerald portfolio, which is starting to move higher after being down for several months. Low carbon energy companies may get a boost in the current situation. 
  • Including an ETF for aerospace and defense companies. Regardless of what happens in Ukraine, there will be more spending on defense in the US, Europe, and Asia.

End

3/01/2022

Weekly Note - March 1, 2022

Portfolios have higher allocations to the gold ETF “GLD” and the commodities ETF “PDBC.”  These ETFs already have or will soon have positive Exceptional Macro MRIs, which means their prices are very resilient.  This MRI condition is consistent with current market dynamics.  Gold tends to do well in times of global stress and/or inflation.  Commodity prices are likely to increase because of sanctions against Russia, a major commodity exporter. 

These are temporary holdings.  The commodity ETF invests primarily in energy (crude oil, gas) and high commodity prices can inhibit growth and further demand for commodities leading to price declines.  As mentioned in prior notes, the algorithms driving our investment in commodities were developed in 2008 and 9.  They have been successful over the years in identifying buy and sell points.  But energy prices are volatile and we can expect the price of the commodity ETF to move up and down.  

From the narrow perspective of the stock markets around the world, the war in Ukraine is coming at an unfortunate time because the natural cycles of resilience are shifting to a more vulnerable phase.  This means that even if there are positive news events related to the conflict, any jump in prices is likely to be temporary.  If there is negative news, prices are likely to fall. 

In more normal times, we would have seen a counter-trend rally over the last four or five weeks and extending for a few more weeks.  A counter-trend rally is a temporary rally in stock prices that would fades as the market resumes a downward trend. In this case, the downward trend began at the end of December 2021 and it likely to continue for a several weeks more. 

The war, inflation concerns, and high stock valuations have weighed on the market and likely subdued the counter-trend rally.  Because of this, we are running out of time for that temporary rally to occur. While a counter-trend rally may still happen, it will be short and difficult to capture without experiencing the subsequent price declines.  

I believe it is unlikely that the markets will shift to a strong positive trend from here.  Investors globally will need time to adjust expectations for growth, interest rates, inflation, and fair stock prices considering geopolitical events.  The upcoming period of vulnerability may induce some panic, which could cause stock prices to drop more than the figure above.  I believe there will be a better time in the future to be aggressive in our portfolios. 

Considering these dynamics, I have reduced portfolio aggressiveness over the last few weeks.  This period of vulnerability is likely to last several weeks. 

Because of the recent changes in the portfolios and the weekly reports, it may be difficult to get a sense of how defensive the portfolios are.  The tables below show the target weights from last week and new target weights for the ETF; the ETFs are grouped by how they are likely to perform during this crisis and a vulnerable stock market.  There is one table for the Diamond and one for the Sapphire main portfolios.   Don’t be concerned if you don’t follow all the details of the table. The key points of this table are in the highlighted boxes:

  • Our portfolios have been conservative (or Defensive) for the last few weeks
  • This week’s target weights call for:
    • Two-thirds of our accounts are in Defensive ETFs that may move higher in times of crisis, including large weights in gold and commodities.
    • Less than 10% is in Aggressive ETFs
Portfolios have high target weights for the consumer staples ETF XLP. The companies in this ETF tend to be resilient when economic growth slows or inflation is high because they sell everyday needs. A list of the top 10 holdings of this ETF is at the end of this note, along with the holdings of the DJIA-linked and utility stock ETFs. The categories for the ETFs are:

Defensive” ETFs are likely to hold and perhaps increase in value a stock market decline or a crisis such as the current one.

Moderately Aggressive” ETFs may experience losses but will move higher should the stock market declines be small and the Ukraine-related crisis be less severe than it currently appears.

Aggressive” ETFs will move higher on renewed optimism in the stock market.


2/16/2022

Weekly Note - February 16, 2022

Please see this page for the terminology I use to discuss the MRI conditions:  https://focused15investing.com/language

Key observations as of last Friday (2/11/2022):

  • The stock market is likely to be less resilient in the weeks ahead. The DJIA Loss-Avoiding algorithms are signaling greater vulnerability. Less resilience is likely despite the Micro MRI for the DJIA being in the upleg of it cycle and at a low level and poised to move higher.
  • Bond prices are likely to decline further. The Macro MRI indicating the long-term trend for the US 10year bond index shifted to a negative trend, which indicates another drop in bond prices. Because bond prices move down when their yield moves up, declining bond price is consistent with the current condition of the US 10-year yield – its Macro MRI is currently in the upleg of its cycle (at the 61st percentile since 1962). Also, importantly, the Exceptional Macro for the 10-year yield appeared three weeks ago. With the Macro MRI for yields to be at the 61st percentile, it would not be unprecedented for yields to move higher for a few months.
  • Commodities are likely to move higher. As of last Friday, the Exceptional Macro for the SPGS commodities index is now present. This shift was unexpected because the Exceptional Macro had ceased being present at the end of last November and the its end often foreshadows a shift to the downleg of a Macro cycle. However, the Macro is still in its upleg at the 74th percentile since 1974, suggesting that commodity prices could move higher for a few months. With the Macro and Exceptional Macro MRI still providing resilience, commodity prices could be resilient for a few months, regardless of the condition (upleg or downleg) of the Micro MRI.
  • A measure of inflation expectations indicates higher inflation expectations over the next several weeks. I use a ratio of the Global Inflation-Linked Bond Index to the World Government Bond Index as the indicator of inflation expectations, which is a common industry practice. The Micro MRI for this series shifted to the upleg of its cycle as of last Friday and was at the 5th percentile since 1997, which suggests inflation expectations have been relatively low recently and will be higher over the next several weeks. Unfortunately, this index does not go back to the high inflation period of the 1970s and 1980s to capture expectations during that time. But the condition of this series is consistent with bond prices moving lower as the Fed tries to reduce inflation expectations by increasing interest rates.
  • Gold is likely to move higher. The Macro MRI is in the upleg of its cycle and the Micro turned to the upleg of its cycle last Friday (at the 38th percentile of levels since 1976).

The observations mentioned above are consistent with further concerns about inflation and the Federal Reserve increasing interest rates.  Higher inflation expectations can push commodity prices higher.  Fed action to reduce inflation expectations by increasing interest rates could erode support for stock prices. 

Market jitters about how all this plays out can result in gold prices moving higher. In Part III of the pdf, you can see on the Sleeve Profile for gold that its Macro MRI appears to be coming to the end of its recent downleg. Although not shown on the Sleeve Profile, the Exceptional Macro may be present in the next few weeks. If these shifts occur, gold prices will be more resilient.   

Because of these shifts, I have added two ETFs to the portfolios.  PDBC is for a broad basket of commodities. GLD is for gold.  You can see additional information about these ETFs in Part III of this week’s pdf.  I have also imposed limits on the weight of the US 10-year bond ETFs to reduce interest rate sensitivity.

I have allocated 10% of each portfolio to the PDBC sleeve and 15% to the GLD sleeve.  I may change these allocations over time depending on how jittery the markets become. 

As an additional note about commodity prices, in addition to inflation concerns a possible cause of their resurging resilience might be geopolitical tensions. Russia is a major oil exporter and tensions related to Ukraine may be a factor in greater energy price resilience. If this is the case and tensions subside, energy prices may be somewhat less resilient.  Also, if a military conflict takes place, I believe the Fed will be less aggressive about raising interest rates.  

Note about PDBC: Some online information providers (those used by smartphone apps) show incorrect price history for this ETF.  The chart below shows the price history from Bloomberg, which I believe to be correct. 


2/01/2022

Example - New Diamond Portfolios and Shares-to-Trade Worksheet

I have been using Diamond sg131 as my main portfolio for several years.  Under the new numbering scheme and portfolio structures, the closest portfolio is Diamond|Onyx  65|35 sg265 – I now consider this my long term portfolio. 

The guidance for reducing account aggressiveness is "Box #3 Portfolio Shift: -1,” which appears in the middle of page 1.  It indicates that I should use the model portfolio one step less aggressive, which is Diamond|Onyx 50|50 (sg250).  

The guidance for Box #2 is 20%. For this account, I always have at least 2% cash in Box #2, so I increase it to 22%.  Using this information in the Shares-to-Trade worksheet linked to the pdf, I get the following:


Note that in the Shares-to-Trade worksheet, I have input my “Long-term Model Portfolio” sg number (“265.1”) and the aggressiveness adjustment “-1” into the “3 Agg Adj” field. 

The worksheet provides the appropriate portfolio sg number for my account (in this case, “250.1” in the “Use Target Weights from sg” field). I then proceed to use the target weights for sg250.1, which is one step less aggressive than my long-term model portfolio (sg265.1).

Please contact me with questions.

1/31/2022

Specific Changes to the Publications - February 1, 2022

All of these changes that affect Diamond publication.

If you use the Sapphire publication, the ones most relevant to you are 3,4,5, and 6.

#1 - New Numbers for the Model Portfolios

The portfolios in Diamond now use a new numbering scheme. All of the Diamond portfolios now have sg (sleeve group) numbers between 200 and 299. This series of numbers - in the 200s - indicate that these portfolios use 2x leveraged stock ETFs, which magnify daily returns by two.

The second two numbers in the portfolio number (e.g., “35” in “sg235”) indicate the maximum allocation to the leveraged stock ETFs. For example, “Diamond|Onyx 35|65 (MAIN) sg235” is a Diamond portfolio and has a maximum of 35% in the 2x DJIA-linked ETF (i.e., DDM).

If you have been using…
  • sg218 as your long-term portfolio, its new number is sg235
  • sg118 as your long-term, its new number is sg250
  • sg131, use sg265, it is the most similar
  • sg147, you can see the weight for DDM on Part III, p1, in the box on the right

The numbers in the decimal place will help me keep things organized when we add tactical sleeves, discussed below. Without a tactical sleeve, the decimal is “.1”.

#2 - All Portfolios Have the Same ETFs

Every portfolio is now a mix of the DJIA-linked and Onyx sleeves. Because of this change all model portfolios have the same ETFs and it will be easier for you to use the target weights of a different model portfolio to adjust the aggressiveness of your account, which is the third change.


#3 - Another Tool to Manage the Aggressiveness of Your Account 

From time to time, I will recommend that you temporarily use the target weights of a portfolio other than the one you have selected to use long term. This will allow us to shift the risk profile without increasing cash levels as much as we have in 2021.

I will give guidance for how many steps to shift away and in which direction from your long-term portfolio. For example, if there is a “-1” in the field marked “Box #3 Portfolio Shift” in the middle of page 1, use the target weights of the model portfolio one step to the left of (i.e., less aggressive than) your long-term portfolio in the chart on page 1. On the other hand, if there is a “1” in that field on page 1, use the target weights of the model portfolio one step to the right of (i.e., more aggressive than) your long-term portfolio.

I will continue to give guidance on the additional level of Box #2 Cash to hold. Going forward, however, we will use this tool for adjusting aggressiveness less frequently. Note that as of this week, we are using BOTH “Additional Box #2 Cash” and a leftward [less aggressive] “Box #3 Portfolio Shift.”

#4 - Box #2 Cash and Box #3 Shift Will Be Guidance for Virtually Everyone

In the past, I have said my suggestion to increase Box #2 Cash is for those with short time horizons (less than, say, 7 years) and/or who are sensitive to losses. I have been aggressive in increasing cash levels for those people.

Going forward, the guidance regarding Box #2 Cash and Box #3 Shift are for everyone except those with very long-time horizons AND who want the simplest trading possible.

#5 – Tactical Sleeves (replacing theme portfolios and add-ins)

In the past, we have used different techniques to add theme-related ETFs. The first was making available an add-in sleeve in April 2020 that included a NASDAQ-linked ETF. The timing of this was good; the NASDAQ ETFs have performed well from then through the end of 2021. We also introduced model portfolios for separate accounts that included a commodity-linked ETF, which was also well timed for the markets over the last roughly two years. Unfortunately, those techniques were cumbersome for users.

Going forward, I will add the most important theme related ETFs directly into the main portfolios. When that happens, I will also update the Shares-to-Trade worksheet. These steps will make it easier for you to take advantage of the themes.

The ETFs most likely to be added are NASDAQ-, commodity-, and gold-linked ETFs. I have added to the weekly publication "sleeve profiles" that show the historical performance of the computer models and algorithms related to holding these ETFs.

The charts illustrate the performance for:
  • The sleeve that actively rotates among the ETFs listed
  • A comparative mix, which is either the
    • The most aggressive ETF held over the entire period, labeled buy-and-hold (B&H)
    • A “neutral mix” of all the ETFs (NM). The comparative mix for Onyx is an equal-weighted mix of all four of its ETFs.
The profiles also show the Macro MRI for these ETFs, which will help you see when we are likely to add or remove these ETFs. These profile pages can be found after the detail pages for the model portfolios.

I am monitoring other ETFs for inclusion as tactical sleeves. These include global stock markets, Bitcoin, and other low-variability stock sectors.

#6 – Easy Access to Shares-to-Trade Current Worksheet

You will find a link to a current Shares-to-Trade worksheet in the middle of page 1 of the weekly publication. This worksheet, like the older worksheet, incorporates the Box #2 cash feature. In addition, it facilitates use of the Box #3 Shift feature. I will update the worksheet when tactical sleeves are added.

#7 - Upcoming Change: Performance of Actual Accounts

With the changes mentioned above, it will be difficult for the current performance system to track performance for these different variables.  I’ll provide more information at a later date. 

Example

Here is an example of what I will do this week in my Diamond account to adapt to these changes.

https://marketresilience.blogspot.com/2022/02/example-new-diamond-portfolios-and.html

1/26/2022

Weekly Note - January 26, 2022

1. Market Comment 


As mentioned in December, the Macro MRI for the DJIA is just beginning a downleg in its cycle, which takes away a key source of resilience from the stock market. This makes the market less likely to fully recover from bad news or negative economic events. Historically, the downlegs last a few months to a few years. My current projections of the Macro MRI suggest this downleg will last at least a few months. Please see this web page for a discussion of the terminology I use: https://focused15investing.com/language.

However, we are close to the bottom of the Micro cycle, meaning that the Micro MRI may soon begin to provide the market with resilience, which would last several weeks. As of last Friday, the Micro MRI was at the 21st percentile of its levels since 1918 and still in the downleg of its cycle. This suggests that the Micro MRI will reach its lower extreme in a week or so. The Plant/Wait/Harvest designations are heavily influenced by the status of the Micro MRI (https://focused15investing.com/plant-wait-harvest).

When the Micro MRI for the DJIA moves to its upleg, we can expect stock prices to be more resilient and more likely to move higher from where they are now – even if there is little long-term resilience (as indicated by the Macro MRI being in the downleg of its cycle).

This pattern - stock prices moving higher when the long-term trend is down - has different names in the industry, including “dead cat bounce,” “relief rally,” “sucker’s rally,” or “bear market rally.” These terms convey the fleeting nature of the rally. However, I prefer the term “counter-trend rally” because it emphasizes that the short-term rally in stock prices runs counter to the larger downward trend.

In my analyses of counter-trend rallies over the last 100 years for the DJIA, I have found that the rallies have often coincided with both (a) a Macro MRI in the downleg of its cycle and (a) a Micro MRI in its upleg. The burst of resilience in the Micro MRI is often enough to overwhelm the lack of long term (Macro) resilience.

During a counter-trend rally, there is a sigh of relief among investors that the recent declines weren’t worse. But when the short-term cycle ends, that relief gives way to anxiety as prices fall again – often to a level that is lower than where the counter trend rally began.

During the downleg of a Macro cycle that covers several quarters or years, there are likely to be multiple counter-trend rallies. Historically, the Focused 15 Investing approach has done well participating in the upleg of the counter-trend rally and getting out before stock prices fall and follow the long-term trend down.

    Current Situation

At the end of last November, the Federal Reserve announced that it would fight inflation and allow interest rates to increase. This event accelerated a change that was already underway in the markets and detected by the MRI.  I saw that the algorithms were likely to be out of sync with the projected stock market MRI conditions for the December 2021 through early February 2022 period.  I concluded that there may not be enough time for the models to become better synchronized before prices fell. I decided to take steps to reduce the aggressiveness of our accounts by increasing the suggested levels of cash. My caution at that time may prove to have been too conservative if prices rebound sharply from where they are now (1/26/2022) and move higher, but I believe the probability of that happening is low. The Federal Reserve, which in the last has taken steps to calm the markets has indicated that it is less willing to do so. Plus, the Macro MRI is more solidly in the downleg of its cycle.  

With the end of Covid-related stimulus and expectations for higher inflation and interest rates that have not been experienced for decades, the markets will need to recalibrate on many levels. We are in the period of recalibration that I mentioned in early December: https://focused15investing.com/blog/f/after-near-term-recalibration-stock-market-is-likely-to-do-well.

The current plan is to follow the models and algorithms to participate in any counter-trend rallies, but do so with higher levels of Box #2 Cash and/or a shift to Box #3 Target Weight shift. We will be looking for a more definitive bottom in the stock market before shifting to a more aggressive stance.

    Trading the Micro MRI

We are now in a market with low long-term resilience; the Macro MRI for the DJIA is in its downleg. The DJIA can move higher than it is now, but those gains are likely to be temporary. Other major stock indexes are currently in the same condition. The current conditions appear similar to the period from 2000 to 2003. This period was when the Dotcom bubble deflated. The Macro MRI was in the downleg of its cycle during this entire period. Let’s take a closer look at that period.

As shown in chart 1, the DJIA dropped about 34% from January 18, 2000 to the bottom in October 7, 2002 (light blue line in chart below). The NASDAQ (black line) peaked a little later, on March 9, 2000. It lost 80% of its value through October 7, 2002.

Chart 1: DJIA and NASDAQ Performance 11/30/199 through 1/24/2005


Focusing just on the DJIA during the period 2000 to the market bottom in 2002, one can see that the declines of that period did not happen all at once or consistently over this 2+ year period. The long-term decline was punctuated by short-term declines and recoveries. These can be considered counter-trend rallies.

Chart 2 (below) shows the DJIA x2 Loss-Avoiding (blue line) and the Onyx (purple line) sleeves from January 2000 through late 2005 on a log scale. One can see that the DJIA sleeve (blue) generally increased over time through to 2003. Onyx (purple) did as well. The entire chart is shown in Note 1.

Chart 2: 2000 - 2006 - Traded DJIA Loss-Avoiding and Onyx Traded Sleeves 


A sharp decline in the NASDAQ and other growth sectors may be underway now, just as in the 2000-2003 period, but additional dynamics are affecting the markets. It appears that both inflation and interest rates are beginning rising trends. The last time we had high interest rates and inflation was in the 1970s and early 1980s.

Our DJIA loss-avoiding sleeves did well during the period of high inflation and interest rates, as shown in the ellipse in Chart 3 (below), which is on a log scale. The performance of the DJIA Loss-Avoiding sleeve is shown below by the green line from 1966 to last Friday. The performance of the DJIA is shown by the red line. A vertical line is shown at the date 1/7/2000 for reference.

Chart 3: Traded DJIA Loss-Avoiding 1966 though Early 2022


During the period highlighted by the ellipse, the algorithms were responding to changes in both the Macro and Micro MRI. The green line moves higher in a stairstep manner when the approach buys low and sells high on the MRI. The results from the approach are positive – the green line moves higher while the red line moves horizontally.

Viewing the long-term history of the DJIA and our investment approach, the approach does well when the market is not in a strong ascending trend. One can see the strong ascent of the DJIA in the late 1990s – just to the left of the vertical line. The approach had positive returns but these returns were not as strong as simply holding the DJIA (red line).

The Onyx sleeve does not go back to the 1970s (because of data limitations), so we cannot make similar comparisons for Onyx. However, many investment strategists believe the Consumer Staples sector of the S&P 500 (ETF “XLP), which is one of the four ETFs in the Onyx sleeve, is likely to do well during times of inflation. See Note 2, below for a recent reference to this sector.

The current situation may be more complicated than the two periods discussed, but I believe the markets will adapt. The important point to keep in mind is that we need to stay engaged with the stock, bond, and other markets over time. Investing is a very good way to protect and enhance our wealth in times of inflation - even periods of low inflation. The importance of investing in stocks is discussed in my December post: https://focused15investing.com/blog/f/after-near-term-recalibration-stock-market-is-likely-to-do-well.


2. Changes to the Publications


In order to navigate this market landscape more successfully, I will implement a few changes to the publication at the next Plant season. Many of these have already been made in the Sapphire publication.
  1. Theme-related ETFs will be included in the main model portfolios, with the most likely near-term candidate for inclusion being the commodities ETF GSG.
  2. All portfolios will be a mix of a DJIA Loss-Avoiding sleeve and the Onyx sleeve, which will make it easier to temporarily use a more or less aggressive portfolio.
  3. We will have two methods of adjusting account aggressiveness – increasing cash levels and temporarily using a different model portfolio.
  4. Current Shares-to-Trade worksheets (one for the Diamond newsletter and one for the Sapphire newsletter) will be linked to each weekly report for ease of access, and I plan to revise these sheets when a theme ETF is added or removed.
I will describe these changes in more detail when they are implemented.

Please contact me with questions or if you have any concerns about these changes.

______________________________________________________________________________

Notes


1. Traded DJIA Loss-Avoiding and Onyx Traded Sleeves (log scale)


2. “Here's Why You Should Invest in Consumer Staples ETFs” - Investors can consider putting their money in non-cyclical consumer staples amid an economic recession. This largely defensive sector is found to have a low correlation factor with economic cycles. Read in Entrepreneur: https://apple.news/A-f2mDy4MSwmJ40D6KasUqw


12/15/2021

Refinements - 2021

Over the last several months, I have spoken with many subscribers about a few topics, including how they use the weekly publication and the recent practice of increasing Box #2 Cash.  This note summarizes the main points of these conversations and how the publications may change in response.  I hope to implement the changes before the next Plant season. Before discussing the refinements, I’d like to say that it is very helpful for me to hear your opinions of the portfolios; thank you.  My main objective is to make disciplined investing work for you.  The model portfolios and weekly publications are a means to that end.

A few main themes from subscribers and my comments:

·         Generally speaking, people are much more comfortable trading ETFs now than they were years ago.  When I first started over seven years ago, people wanted to trade just a few ETFs and were bothered when trades were clustered (meaning, for example, buying shares of UST one week and selling shares of UST the next).  I initially created model portfolios with one to four ETFs, and I intervened in the algorithms when I believed trades would soon be reversed.  Going forward, we will have portfolios with three to five or so ETFs, and I will not intervene to reduce clustered trades.  

·         Some people trade only a few of the ETFs in their selected portfolio.  In order to get the highest return with the lowest risk, one should trade all ETFs in the portfolio.  The only optional ETF is “SHY,” which has a cash-like return right now.  In a year or two, it may have a higher return, so I temporarily label it “optional holding,” and the corresponding amount of cash should be held as cash in your Schwab account. 

·         Some people have switched model portfolios a few times over the course of the last year.  Until the new refinements are fully implemented in a few weeks, the publications are not designed with switching in mind.  Especially in the early years of Focused 15 Investing, there was, by design, a wide range of portfolio structures in a single publication.  Some portfolios were aggressive.  Others were conservative.  Some rotated more aggressively. Others were stable. Some had more ETFs and some had fewer.  When I designed them, I thought it would be best to allow people to select the model portfolio right for them based on how many ETFs they wanted to trade, their risk tolerance, and how actively they wanted to rotate among the sleeves within the model portfolios.  Using the current and earlier portfolio lineups in the publications made switching based on recent performance problematic.  If one tried to improve returns by switching, one might switch TO a portfolio that has just finished its period of strong returns because of its structure.  Such switching is often too late.  To compound the losses, one could be switching FROM a portfolio that will soon begin its period of strong returns resulting because of its structure.  Going forward, all portfolios will have the same general structure and differ only in aggressiveness.  I’ll discuss this more in the future. 

·         People like the practice of increasing cash, which I discuss below.  Even those with long time horizons increased cash in 2021 and liked the practice. 

Box #2 Cash

The discipline of increasing cash is viewed favorably by virtually everyone.  As implemented over the last year or so, I suggested to people with short time horizons to increase the cash in their accounts when the MRI displayed what I consider a flash signal that has historically indicated a high risk of sharp but short declines that were difficult for the algorithms to respond to or navigate using our regular Friday trading schedule. These flashes occurred rarely, and one occurred just before the Covid crash in 2020. 

As luck would have it, in early 2021 there were several such flash signals.  However, NONE were followed by declines. By increasing the cash levels in response to these flash signals, our accounts had lower returns than the model portfolios we were following.  In 2021, the market moved higher consistently and any move out of the market hurt returns.  Very likely, the markets in 2021 were buoyed by various forms of pandemic stimulus, which probably made this practice unsuccessful. 

I discussed with subscribers the fact that increasing Box #2 Cash caused our accounts to underperform the model portfolio, yet most still liked the practice.  At the time of our conversations, they could recall the seemingly precarious nature of the markets at those times, and they liked my intervention. They also liked being able to take a psychological break.  I too have appreciated increasing cash levels during 2021.  I have slept better in 2021 than in 2020. 

Even so, I must be an advocate of getting the disciplines right and getting higher returns.  We need to have a better approach to making our accounts less aggressive in unusual situations. Increasing cash is a very blunt instrument. In most of the portfolios there are ETFs that should perform well during times of stress, such as UST and XLP, and increasing cash takes money away from these ETFs.  In addition, the amount by which to increase cash is subjective, which is a drawback.

Additional Option for Reducing Aggressiveness of Our Accounts

In the last few months, while researching forces that may drive the movement of the MRI, I identified additional signals that I believe will give us greater lead times in preparing for some vulnerable periods. While these signals are not currently strong enough to build into the algorithms themselves, they can be leveraged to implement an additional option for reducing the aggressiveness of our accounts, in addition to the current option of increasing cash levels. Both these options would be for those wishing to reduce risk of market declines (e.g., individuals with time horizons less than, say, 7 years).

Specifically, the new option is that I would instruct subscribers to switch to a model portfolio than the one they have selected for long-term use. This instruction could be gradual in the sense that I could suggest an addition switch later on to further reduce aggressiveness. My instruction would be informed by, among other things, the greater lead times in preparing for vulnerable periods (mentioned above). I expect that instructions to move to a less aggressive portfolio would be given within our regular Friday trading framework in most cases. This option is more methodical than the option of instructing subscribers to increase cash levels, which could occur at any time during the week,

The second option would be to give guidance to increase Box #2 Cash as we have done in 2021.  I would give this guidance in cases that require immediate action. 

We all must recognize that reducing aggressiveness may reduce our returns compared to staying with our selected portfolio.  But the mental health benefits of a switch may be worth that cost.  Again, those with long time horizons should generally avoid reducing the aggressiveness of their portfolios. 

On the surface, switching portfolios goes against the well-justified admonition to avoid switching portfolios that I espoused for many years. But the reality is that we need to manage our psychological health and be mentally ready to invest over the long periods ahead of us.  As investors, our risk tolerance does change over time especially we trade our own accounts.  The last few years have shown us the challenges of managing one’s own account. 

Current Period

Turning back to the projections of vulnerable periods that might not be navigated quickly enough by the algorithms, the present time is a key example of a period of projected vulnerability. While the MRI and computer models indicate that the market is still somewhat resilient, the projections have indicated that this time (early December of 2021) is likely to be the beginning of an especially vulnerable period – one that occurs every few years.  In similar conditions in the past, the algorithms responded but the response was a week or two late because the market had been especially strong just prior to the period.  The time from the projected beginning of the period of unusually high vulnerability to the actual strong stock market declines is from one to roughly seven weeks.  In addition, the higher the stock market valuations, the closer to the projected beginning of the period of vulnerability.  Both of these conditions appear to be present now. 

These conditions cause me to be concerned about stock market losses over the short term, despite believing that past government stimulus and future spending will strongly support economic growth and support stock prices.  Our philosophy is to respond to the changes in resilience/vulnerability and not factors such as government spending. We may find that the stimulus again overwhelms the market’s vulnerability and stock prices may stay level or even move higher. If the Fed follows through on promise to allow interest rates to increase, it will cause investors to be less tolerant of high stock valuations, high real estate prices, and high commodity prices.  Since investors’ lower tolerance for these could be coming during a time of higher natural vulnerability, I believe it is prudent to be less aggressiveness with our accounts. 

Because I could not test, introduce, and answer any questions shifting model portfolios to reduce aggressiveness, I increased cash levels and took other measures to reduce risk during this period.  I believe it will be the last time I use this process to the current extent. 

Switching Model Portfolios to Reduce Aggressiveness

Going forward, I will indicate when we are coming to a vulnerable period that might not be navigated effectively by the algorithms.  Those with short investment horizons, can downshift to a less aggressive model portfolio.  This way, we can stay invested in the portfolios but reduce risk as we approach what I expect to be vulnerable periods.  I will maintain the option of increasing Box #2 Cash for more extreme cases. 

By refining the practice of switching portfolios, we may find other options for using it.  After a major market correction, some may want to temporarily use a more aggressive model portfolio.  I will indicate those times as well.  If you want to reduce aggressiveness for purely personal reasons, the publication and shares-to-trade worksheets will be set up for you to easily use a different model portfolio and stay invested.

I’ll provide more information over coming weeks. 

===============================

12/08/2021

After Near-Term Recalibration, Stock Market is Likely to Do Well

The markets are likely to go through a process of recalibrating stock and bond prices to accommodate higher inflation, higher interest rates, and a Fed that is less willing to step in with support when the economy or capital markets feel distress. Stock prices may experience downward pressure when faced with higher interest rates but upward pressure with stimulus-induced economic growth. All else equal, downward pressures will result in sharper market declines during a period of unusually low resilience that I expect to begin in December. 

We may find that stimulus-induced strong economic growth more than compensates for the lack of resilience - and we may miss some positive returns if this happens. But our philosophy is to reduce our exposure to stocks when the market is vulnerable. Moving in and out of stocks is cheap and easy to do. We need to be looking ahead to the period after the next Plant season when it is appropriate to be aggressive.

This post discusses the current situation and a possible future condition that will be more economically rational and, I believe, better for the economy, for stocks, and for our portfolios. I believe we need to adjust our thinking to this emerging new reality because parts of it have not been experienced for decades. 

Sharp Minds Expect a Deep Decline in Stock Prices

Jeremy Grantham is a well-respected investor thinks it will be big. Here is a Q and A he had with Reuters in July 2021 (https://www.reuters.com/business/bubbles-bubbles-everywhere-jeremy-grantham-bust-ahead-2021-07-20/):

·  Q: What is your take on equity valuations now?

·  A: Looking at most measures, the market is more expensive than in 2000, which was more expensive than anything that preceded it.

·  My favorite metric is price-to-sales: What you find is that even the cheapest parts of the market are way more expensive than in 2000.

·  Q: What might bring an end to this bubble?

·  A: Markets peak when you are as happy as you can get, and a near-perfect economy is extrapolated into the indefinite future. But around the corner are lurking serious issues like interest rates, inflation, labor and commodity prices. All of those are beginning to look less optimistic than they did just a week or two ago.

·  Q: How long until a bust?

·  A: A bust might take a few more months, and, in fact, I hope it does, because it will give us the opportunity to warn more people. The probabilities are that this will go into the fall: The stimulus, the economic recovery, and vaccinations have all allowed this thing to go on a few months longer than I would have initially guessed.

·  What pricks the bubble could be a virus problem, it could be an inflation problem, or it could be the most important category of all, which is everything else that is unexpected. One of 20 different things that you haven't even thought of will come out of the woodwork, and you had no idea it was even there.

·  Q: What might a bust look like?

·  A: There will be an enormous negative wealth effect, broader than it has ever been, compared to any other previous bubble breaking. It's the first time we have bubbled in so many different areas – interest rates, stocks, housing, non-energy commodities. On the way up, it gave us all a positive wealth effect, and on the way down it will retract, painfully.


I have met Jeremy a few times for one-on-one conversations and have a great deal of respect for him.  He has a strong interest in valuations and has often been early in prior calls for markets to decline.  

I believe it will be a shift in resilience that starts the bubbles to pop. Based on the MRI research, the timing of that period of low resilience is likely upon us now. My theory of what pops the bubble is different than his, and I will discuss it in a future post.

Inflation Is Now Increasing

Inflation has been in the news recently. This month’s inflation reading is expected to indicate that prices have moved up over 6% since last year, the highest rate since 1991.  (https://finance.yahoo.com/news/consumer-price-index-what-to-know-this-week-190934215.html)

I believe there will be higher inflation and that a good case can be made that there should be higher inflation for an extended period, and Powell would probably agree with me on this.

Powell as an Inflation Fighter

Many articles on Powell’s recent reappointment focused on the need to battle inflation, as indicated by headline: “Biden Picks Jerome Powell to Lead the Fed for a Second Term as the US Battles Covid and Inflation.”

(https://www.cnbc.com/2021/11/22/biden-picks-jerome-powell-to-lead-the-fed-for-a-second-term-as-the-us-battles-covid-and-inflation.html)

I believe that the Fed’s efforts to fight excessive inflation are important. They should strive to keep inflation from getting out control as it did in the 1970s. But I also believe the ultimate goal of the Fed and the policy makers around the world will not be extremely low inflation, such as the low levels of the 2008 to 2018 period - but instead a moderate level of inflation. A level of 2 to 4 percent might be more realistic for a protracted period.   

Global Economies Have Recently Confronted Something Worse than Inflation: Deflation

After the global financial crisis in 2008/9, inflation declined so much that the major concern among central banks around the world was not inflation but deflation – where prices decline over time. While this sounds good, it tends to harm economic growth. When consumers get a sense that prices will be lower in the future, they put off purchase to wait for better prices. When they do that, production declines and economic growth slows. Here is an article about deflation and I have included (below) the key passage (https://www.thebalance.com/what-is-deflation-definition-causes-and-why-it-s-bad-3306169):

·  Deflation slows economic growth. As prices fall, people put off purchases. They hope they can get a better deal later. You've probably experienced this yourself when thinking about getting a new cell phone, iPad, or TV. You might wait until next year to get this year's model for less.

·  This puts pressure on manufacturers to constantly lower prices and develop new products. That's good for consumers like you. But constant cost-cutting means lower wages and less investment spending.

For much of the 10-plus years after the global financial crisis, central banks sought to induce inflation and the US Federal Reserve set an inflation target of 2%, annually, which it struggled to achieve. Here is a quote from one of many articles on the topic from 2015 (https://www.cnbc.com/2015/10/13/the-us-is-closer-to-deflation-than-you-think.html.):

·  Nonvoting member James Bullard, who heads the St. Louis Fed, is among those pushing for a rate increase, as he believes policy has helped make “cumulative progress toward committee goals,” as he said in a speech Tuesday.

·  Fed Gov. Lael Brainard, who does have a vote on the FOMC, countered that deflationary pressures argue against an increase.

·  Our economy has made good progress toward full employment, but sluggish wage growth suggests there is some room to go, and inflation has remained persistently below our target,” Brainard said in a speech Monday. “With equilibrium real interest rates likely to remain low for some time and policy options that are more limited if conditions deteriorate than if they accelerate, risk management considerations counsel a stance of waiting to see if the risks to the outlook diminish.

How Inflation Might Be Used to Address Our High Levels of Debt

Inflation is likely to be higher over the coming years not only because of Covid stimulus,  infrastructure, and climate spending, but also because higher inflation addresses a more fundamental problem the US and other countries have. The article below requires a subscription, but I have included key sections below (https://www.bloomberg.com/opinion/articles/2021-11-16/greenspan-s-bond-yield-conundrum-has-returned-to-haunt-markets):

The writer, John Authers, does a good job of laying out a few key points:

  • This chart is from Deutsche Bank’s indefatigable financial historian Jim Reid and goes back to 1800. It compares debt/GDP ratio with real yields defined as the prevailing 10-year rate subtracting the five-year rolling average of inflation:


[Note from JHansen: The above chart focuses on just the US. I have added three big blue arrows to indicate the three earlier periods of low real yields (dark blue line labelled “SmoothRY”) and high Debt-to-GDP ratios (light blue line), plus, in yellow, the current period. The key thing to note is the high debt-to-GDP levels under the four arrows. Generally speaking, high levels are bad.]

·  On this view, real yields have been as low as this three times before in the last 200 years: during the U.S. Civil War, the Great Depression, and finally in the aftermath of the Second World War. In all cases, for obvious reasons, debt spiked. That has happened again [yellow arrow, JHansen], although not for reasons as horrific as a war or a depression.

·  The low real yields associated with the Second World War came during a period of explicit “financial repression” when the government held them [real bond yields] low to make it easier to pay off the debts incurred to finance the conflict, and the Fed had to surrender its independence for a matter of years. The Reid hypothesis is that with another epic debt pile to pay off, another episode of financial repression lies in our future. He also suggests that a combination of inflation (to reduce the value of the debt) and repressed yields (to make it cheaper to service) mean that real yields will stay negative for the rest of his career, and that this unenticing option is superior to the alternatives:

·  Financial repression has always won out. The previous debt spikes occurred around the Civil War, WWI and WWII. This latest climb had been steadier (but substantial) until Covid, which may explain why real yields have steadily but consistently declined. However, the economic response to Covid has been more akin to a war time response, with debt and spot real yields both spiking in opposite directions just like that seen around and after the wars discussed above.

·  [W]ithout financial repression, real yields would likely be consistently positive at the moment given the weight of global debt. But given this global debt pile, that would strongly increase the probability of financial crises across the world. So the risk to my “rest of my career” view is that something happens in the years ahead that prevents the authorities using financial repression. If this occurs then the global financial crisis may look like a dress rehearsal for a much bigger event. So the incentives for the authorities are there.

·  Beyond that, a world of financial repression would continue to be a world of TINA, where we are left grudgingly to buy stocks because There Is No Alternative [TINA = There is no alternative. Low yields mean that bonds deliver lower returns to investors. - JHansen]. It’s not appealing, and arguably it’s not really capitalism, but it might be the best way forward. It’s also a worryingly good explanation for the continued low long yields.

Low “real yields” means that the yield on bonds is low compared to the inflation rate, and “long yields” are yields on long term bonds.

"Financial repression" is known to those at the Fed.  Here is quote from a Fed paper on the topic (https://www.richmondfed.org/publications/research/econ_focus/2021/q1/economic_history):

A Tool of Debt Liquidation: In many countries during 1945-1980, financial repression effectively lowered the real returns to government debt holders and helped governments reduce their debt-to-GDP ratios, according to research by Reinhart and M. Belen Sbrancia of the IMF. Based on their calculations, real returns on government debt were negative in many countries over 1945-1980. The real returns to bond holders averaged -0.3 percent in the United States, and real returns were even lower on the bonds of those European governments that had been particularly ardent practitioners of financial repression, coming in at -6.6 percent in France and -4.6 percent in Italy. ... Ever since McKinnon and Shaw, financial repression has been associated with inflation...

Given this discussion, we might expect 1) bond yields and interest rates to increase enough to introduce greater sensitivity to stock valuations over the short term and improve only slightly the long-term return to some bond sectors, 2) interest rates  still low enough to encourage economic growth despite there being elevated inflation. 3) some upward pressure on stock prices because stocks have pricing power and can pass on any their higher costs to their customers, If this does turn out to be the case, investing in stocks will be most beneficial because of TINA – there is no alternative.

One Final Opinion: Expect to “Muddle Through” as Opposed to Expecting a “Crisis to be a Cleanser”

When I started in the investment business years ago, I thought of the economic and stock market cycles as periodic waves of getting rid of the old, inefficient aspects of the economy and allowing new ones to grow. While this rhythm does indeed take place, the periodic purges and sprouting new ways have never been as big as I thought they should have been. It is true that when the housing crisis started in 2007, it seemed that financial leverage and novel ways of packaging investments had become excesses before the crash of 2008, and these excesses were addressed.

When the dot-com bubble inflated in the late 1990s, there was much talk about the extreme valuations of companies with little or no revenue, and the subsequent bust of the bubble addressed those excesses. After the run-away inflation of the 1970s, it was clear that inflation had to be addresses, and Paul Volker increased interest rates and inflation was tamed by the early 1980s.

To be sure, these were major adjustments, but it surprised me at those times just how much of the economy continued and absorbed these changes. It surprised me how much stayed the same.

I think I had in mind the experience of the Great Depression when the stock market dropped about 80-plus percent, the economy in the 1930 was indeed a shambles, and it took years (and probably WWII) to get back on its feet. After that collapse, the economy and the country were completely different in many ways. I think I was expecting change of similar magnitude. But now, I realize that this expectation was unrealistic.

The economic collapse after the 1929 stock market crash was different. At the time the Fed and the government responded with a tough-love approach. There were government and business leaders who expected and maybe even welcomed a cleansing crisis that would abolish the excesses and provide fertile soil for new economic growth. This is a quote from a very interesting Federal Reserve history piece (https://www.federalreservehistory.org/essays/great-depression):

·  A few governors subscribed to an extreme version of the real-bills doctrine labeled “liquidationist.” This doctrine indicated that during financial panics, central banks should stand aside so that troubled financial institutions would fail. This pruning of weak institutions would accelerate the evolution of a healthier economic system. Herbert Hoover’s secretary of treasury, Andrew Mellon, who served on the Federal Reserve Board, advocated this approach.

However, as the article indicates, this view is now considered by the Fed to be a mistake. Instead, during a crisis the Fed should be very benevolent so the economy does not collapse and gets back to growth quickly – economic growth addresses many problems. One need only look at the response to the Covid crisis to see that this mindset still prevails at the Fed and in our broader government, which have been excruciatingly benevolent. But the Fed has concluded, rightly I believe, that addressing the subsequent excesses resulting from benevolence when the economy is stronger is much better than not being benevolent during a crisis.

This means that we will muddle through each crisis and muddle through the effects of the remedies used to prevent economic collapse during each crisis. At present, this means addressing inflation while promoting economic growth and allowing the debt level to shrink in proportion to the growing economy.

I expect the Fed to allow the economy to run “hot,” which means that it will encourage economic growth and allow a moderate level of inflation to take place. Stocks will be likely be the main investment that produces a strong return in these future conditions. Thus, after an initial period of recalibration and potential decline, I expect stocks and to be influenced by the natural cycles of resilience.  

I always pay attention to what Jeremy Grantham says. He may be right about a big decline that results in lower stock valuations.  But even during the collapse of the internet bubble in the early 2000s, the natural cycles of resilience still allowed the MRI-based process to generate good returns. The same was true in the 1970s with its high inflation and the 1980s when inflation was fought. The same was true before and after the stock market peak in 1929.  I expect our portfolios to do well in the environment described above and in other environments that are used to muddle through. The natural cycles persist.  

Again, the implication for us is to get out of the stock market when it is vulnerable and to be ready to participate later in the growing economy, to earn high returns in our portfolios, and to keep well ahead of inflation when markets are resilient.

----------